Radar Chart Widget
Basics
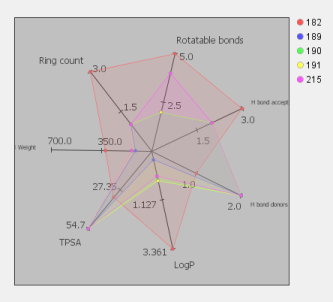
The Radar chart Widget allows many variables (at least three) to be plotted against each other in a 2-dimensional view. This can be useful for showing relationships and correlations between many data items in a multi-dimensional environment. The angles between any set of axes have no internal meaning as such, but the axis length is related to the defined range set for that axis. You will notice that each line graph, shown by a different colour, represents a single data point. A label or legend field for each point can be set to help identify points (the default is the ID field for the entity). If for any reason a particular data point contains a value outside of the specified range then for that axis it is logically truncated to the minimum or maximum value in the axis range. To be easily identified, such data points are drawn with a different shape (cross instead of ellipse). The actual value represented by any data point is visible via the tool tip (by hovering mouse cursor over the data point). Indeed, if no value (null) is available for the point then that point cannot be shown. Please note : This widget type is best used with complete data sets i.e. no or very few null values.
Radar chart is also sometimes referred to as a 'spider' plot.
The Radar chart:
Creating a radar chart widget.
Switch to design mode of your form and add a visualisation widget using the visualisation widget icon  . In the first step of the wizard choose Radar as the widget type.
In the second step of the wizard you need to choose the fields that are to be displayed as axes and notice you will need to select at least three fields for this chart type. Also you can set the Legend field or accept the default cd_id. Other settings are optional, and all settings can be adjusted later.
Settings.
To edit the settings in Design mode double click on the Widget and the settings editor will open. In either mode select the widget by single clicking on it and then click on the Widget Settings icon (  ) in the Form toolbar. Or alternatively right click on the widget and select Customize Widget Settings item.
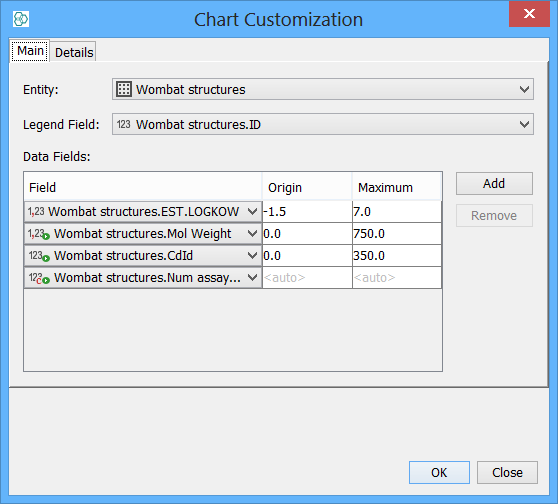
Main tab
Entity
-
Specify the entity the fields will source from. All fields must come from the same entity.
n Fields
-
The set of n fields whose data is displayed. This is restricted to numeric fields and can be added and removed accordingly.
n field settings
-
You can specify a default range for each axes or leave this to be determined automatically from the data points in which case it may change when you change selection or execute a different query depending to which layer data layer the chart is bound (see Data Layer description below). As such you can state the origin and maximum value for each dimension. Often it is best to set min and max values for all axes so that the axes do not continually adjust when the data changes and you have a constant frame of reference. It is possible to enter minimum value bigger than maximum value, in this case axis is inverted.
Legend field
-
You can specify a legend field to label your data points in order to help identify them.
Customisation:
Details tab
Rows limit
-
When there are more than this stated number of data points then in this setting, the radar chart is not shown. This is due to the nature of radar chart which is supposed to be used for small-to-medium-sized data sets. With large number of data points radar chart starts to be confusing and less useful.
Title & Border
-
You can optionally choose a title & border style for your plot.
Chart line widths
-
The width of the lines in each radar chart can be adjusted over a range of relatively fine to coarse.
Fill web & Show axes tick box
-
You can optionally choose to fill a radar chart with the same transparent colour as each radar chart line. You can optionally choose to show the increments on the axis lines up to the stated range.
Details tab:
Performance considerations
Since radar chart is supposed to be used with relatively small-sized data set there should not be any big performance issue.
Query mode
Radar chart widget does not currently support query mode. If you need to be able to query using the fields from the radar chart then this needs to be added to the form as a normal widget.