Curve Fitting
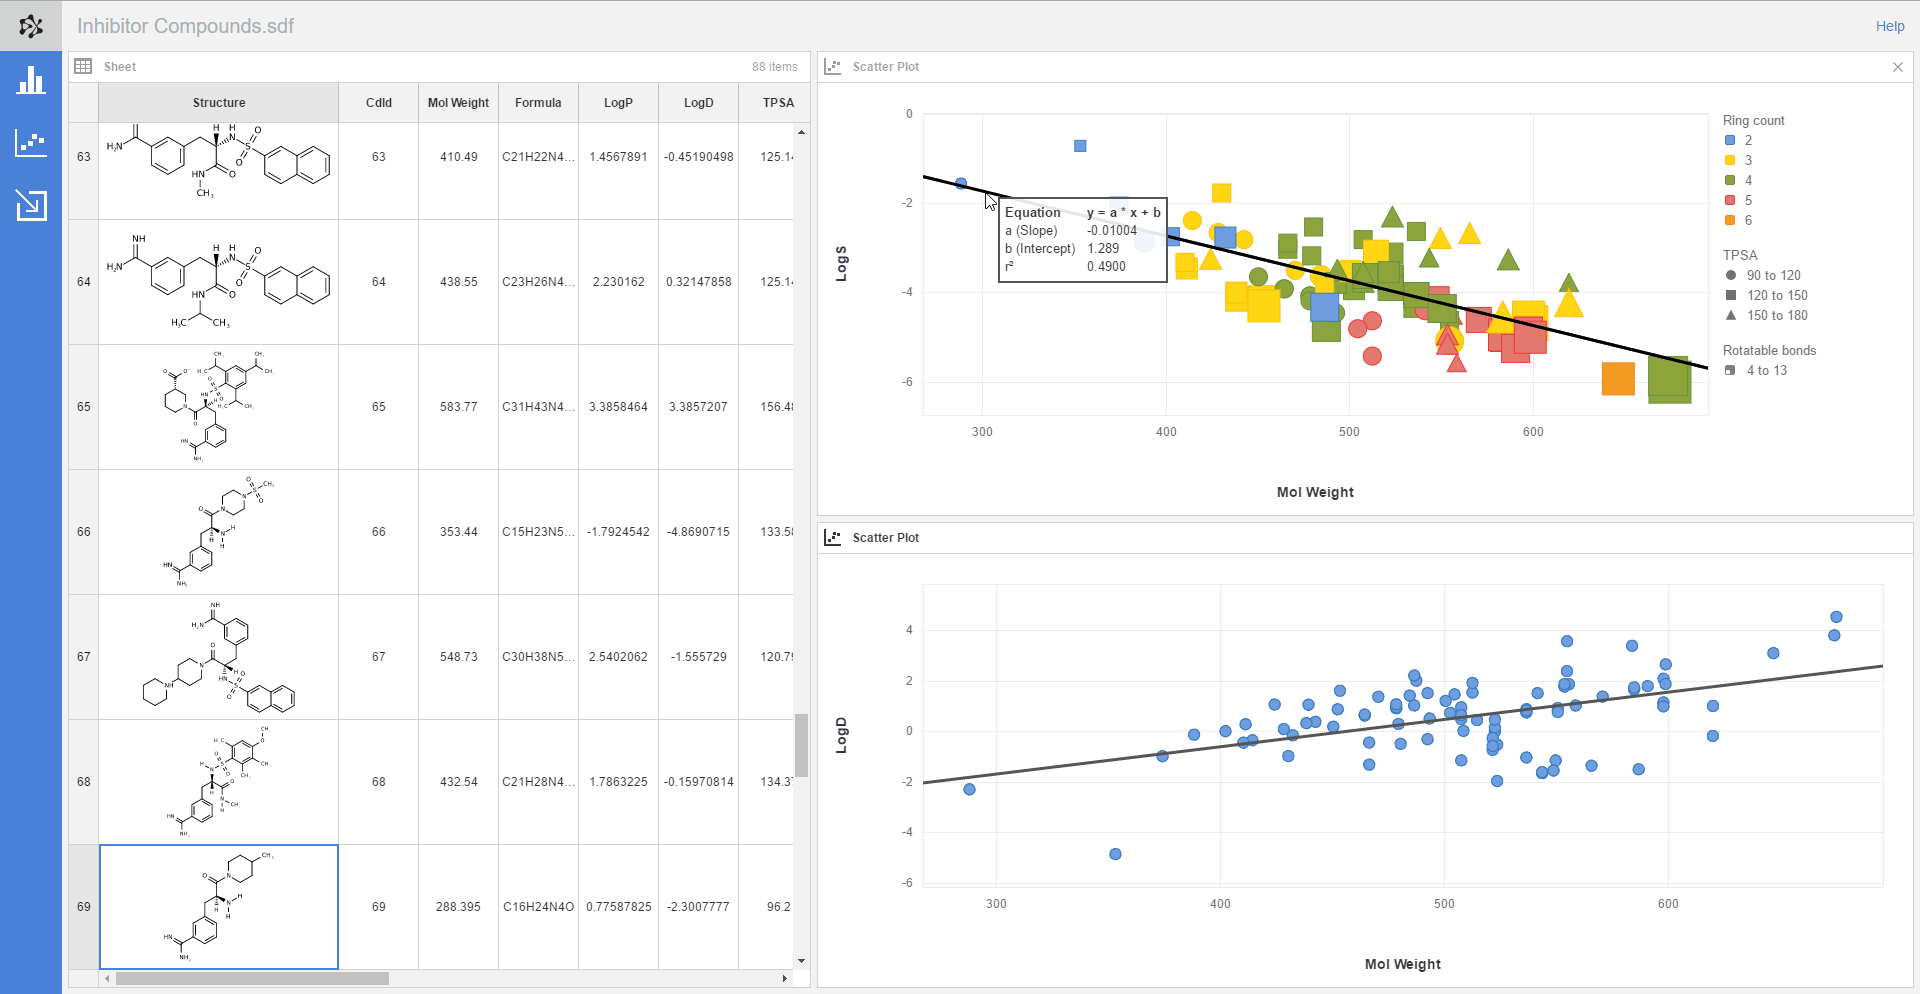
Plexus Analysis can perform linear and nonlinear regression in order to fit various models to your data. You can calculate the parameters of the best fitting curve and display it in a scatter plot. Analysis also calculates the coefficient of determination (R2) in order to see how well the model replicates the observed outcomes. Both linear and nonlinear regression are available from the pop-up menu of scatter plots after a right-click.
-
Simple linear regression: calculates the parameters (slope and intercept) of the best fitting straight line. The parameters can be used
-
to give predictions for additional data points (extrapolation or interpolation) or
-
to check whether there is a linear correlation between the dependent and the independent variables, i.e., between the values on the Y- and X-axis.
-
-
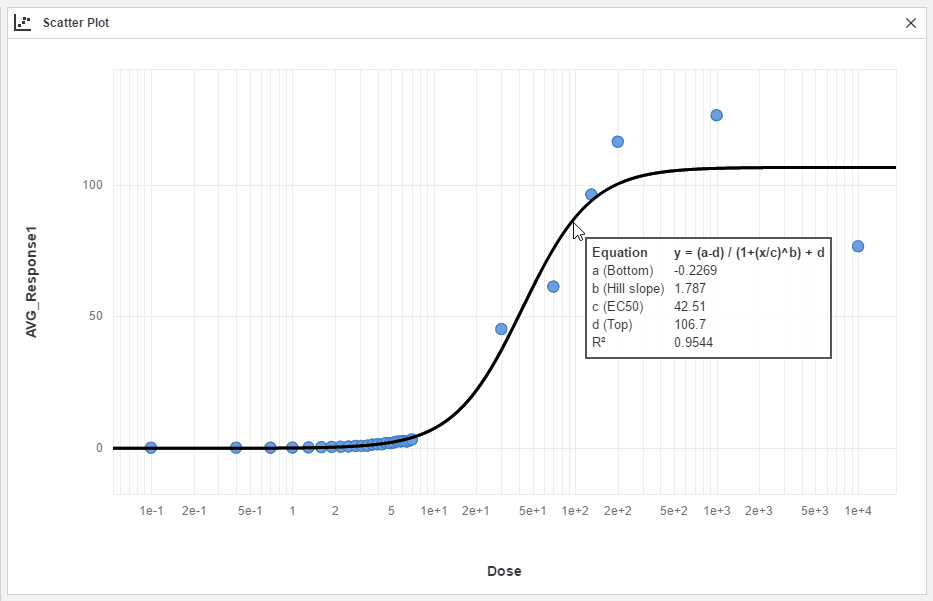
Nonlinear regression: fits a nonlinear model to the data points. Currently, Plexus Analysis can fit the "4 parameter logistic" function. This function, which calculates the parameters of the best fitting symmetric sigmoid. This function is most frequently used for receptor-ligand binding assays in order to characterize dose-response data sets.
The model function and its parameters are:
y = (a - d) / (1 + (x / c)^b) + d-
a: the minimum asymptote of the sigmoid (bottom);
-
b: the Hill slope;
-
c: the inflection point of the curve (the EC50 or IC50 value of a dose response data set);
-
d: the maximum asymptote of the sigmoid (top).
-