Box Plot Widget
Basics
The Box Plot Widget is used to depict many single box plots. It is an elegant way, how to visualise key statistical measures, such as median, mean and quartiles. A single box plot can be used to represent all values, but usually more box plots is depicted next to each other. Each box-plot visualise the set of values upon a single category. Big advantage of this type of plot lies in the representation of a smaller data sets for which histogram does not suit well. Simple rule may sound, use the box plot chart when there is not much discrete values in a category field and usage of the histogram would not be so effective. On the other hand it's pointless and practically not possible to have dozens of box plots in a single chart.
One of the usage example is given bellow. H bond donors was chosen as a suitable category field and logP were chosen as the value field. Spread of the values upon category is easily seen in the chart. Trend and other statistical properties are depicted by specific symbols. Legend and definition of these is explained right after introduction.
The Box plot chart:
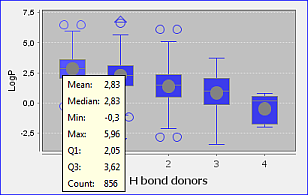
All exact values of depicted statistical measures are clearly arranged shown in the tooltip if you point the box plot with mouse cursor. Controls and features are pretty much consistent with other types of plots. It also supports zooming by using right mouse drag from up to down and selection(hold Shift for multiple selection).
Description
|
The blue box |
It represents the "interquartile range", abbreviated "IQR", IQR = Q3 â?" Q1. The IQR is the measure of how spread-out the values are |
|
Blue circle |
It represent an outlier, shows an approximate location. More circles are shown if more outliers is present. An outlier is defined as the value less then Q1-1.5*IQR and greater then Q3+1.5*IQR |
|
Blue triangle |
Presence of far lying outlier(s) is indicated by a blue triangle. It is always shown on the edge regardless the actual value |
|
Whiskers |
They represent sample minimum and sample maximum |
|
Grey circle |
It shows the mean of all values including outliers |
|
Grey line |
It shows the median of all values including outliers |
Creating a box plot widget.
Switch to design mode of your form and add a visualisation widget using the visualisation widget icon  . In the first step of the wizard choose Box Plot as the widget type. In the second step of the wizard you need to choose the fields that are to be displayed. One will form the category and the other the values in certain category. Other settings are optional, and all settings can be adjusted later.
Settings.
To edit the settings in Design or Browse mode select the Widget by single clicking on it and then click on the Widget Settings icon (
) in the Form toolbar. The settings editor will open. Alternatively double-click on the widget in Design mode or r-click and chose Customize Widget Settings .
Main tab
|
Entity |
Specify the entity the fields comes from. Usually this is the parent entity, though it is possible to display a box plot of data from a child entity in which case data in the child entity that corresponds to the currently selected parent row is used |
|
Value field |
Specify the set of data which are statistically analysed |
|
Category field |
Specify the discrete set of values according to which the set of data is divided into the groups for analysis |
|
Value axis label |
It can be manually set if the default is not suitable |
|
Category axis label |
It can be manually set if the default is not suitable |
|
Axis specification |
Y-axis interval can be set, if the default covering all values is not what is needed |
Selection
Bars in the box plot can be selected by left-mouse click. Use Shift + click for multiple selection. The rows within that region then become selected in other widgets.
Zooming
R-click popup menu, mouse wheel or an area selection can be used for zooming. Select an area by dragging mouse from up to bottom. Range is reset when dragging from bottom to up.
Query mode
Box plot widget does not currently support query mode. If you need to be able to query using the fields from the box plot then this needs to be added to the form as a normal widget.
Controls
Summary of controls
Dragging == mouse-dragging with left button pressed.
Click == left mouse click.
-
Zoom:
-
Ctrl + dragging from up to bottom performs zooms in
-
Ctrl + dragging from bottom to up resets zoom
-
Scrolling mouse wheel zooms in/out
-
-
Selection:
-
Click create new selection
-
Shift + click adds/removes to/from selection
-