Reporting a problem - debug information
Introduction.
Debug information is almost always needed in order to help resolve bugs and problems within software, such as IJC. We welcome reports which help us to improve IJC or are very happy to respond to requests for help. In order to solve the problem, we might request some information from you. There are several different kinds of information about the state of the IJC product. Here is a short guide how to get the information from your machine and to our bug tracking systems. Before you send us information, it is useful to consider the specific problem you have encountered.
Please be sure that the report contains following:
-
What actions you have done in IJC to encounter the issue.
-
Consider, What did you expect to occur?
-
What actually happened instead?
-
Adding debug information will really help us to isolate issues quickly.
Version information.
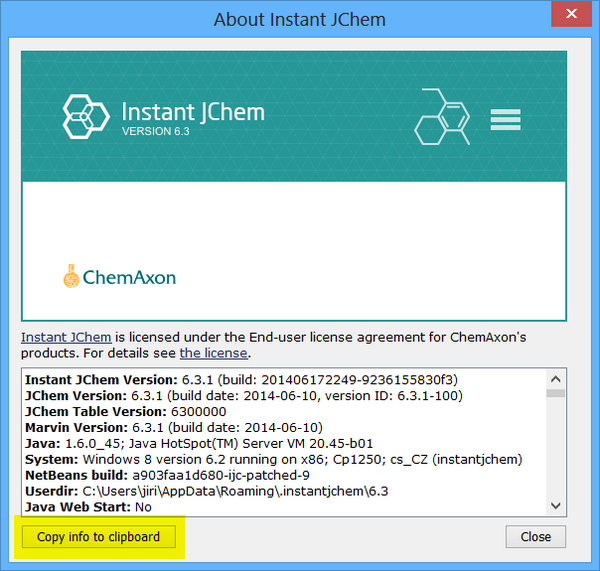
Which version of IJC do you use? Which plug-ins are installed? This information is located in About Instant JChem dialog box. It is accessible under:
Help -> About Instant JChem -> Copy info to clipboard
All info visible in about box will be copied to clipboard (paste into report e-mail).
IJC log files.
It's located under IJCuserdir/var/log subdir. To find out IJC Userdir look at Help -> About.
Usual locations on Windows 7 operating system are:
C:\Users\username\AppData\Roaming\.instantjchem\ijc_5_12dev\var\log - for locally installed IJC client.
C:\Users\username\.instantjchem\ws_www.chemaxon.com_stable\var\log - for Java Web Start version.
All files in given directory can be useful, but usually we need to look at messages.log file. For solving problems with JWS launcher, please send us the jnlpinstaller.log file.
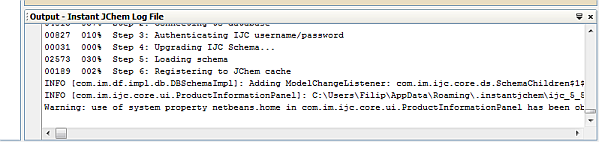
You can also view this file in IJC. Go to View -> Instant JChem Log File. Output is shown in the bottom of IJC application. It is possible to copy selected content to clipboard or save it as file using right mouse button and chose the option from context menu. Unfortunately most of the time this approach does not show/copy the whole file.
Thread dump.
Thread dump is a textual dump of all the active threads and monitors of the Java applications running in a Virtual Machine. It is very useful source of information for debug, which shows us the runtime snapshot of IJC. Please proceed according to the instruction manual below. We describe here few ways how to get thread dump. Your choice depends on whether IJC freezes completely or if the user interface is still accessible.
IJC is completely frozen (deadlock):
It is not possible to control the application at all. Buttons doesn't respond to clicks and it is not possible to browse menu or exit the application normally. In this case we'd need a complete thread dump. This can be done using a few tools which are distributed with JDK and thus Java Development Kit must be installed on the computer. This approach is particularly useful when IJC is working on some task suspiciously long, IJC takes significant CPU time (up to 100% sometimes) and the task normally finishes quickly, but this time (on this specific data for example) it's not finishing. Then this approach should be used.
Tools jps & jstack
Latest JDK version can be found at Oracle:
[ http://www.oracle.com/technetwork/java/javase/downloads/index.html |http://www.oracle.com/technetwork/java/javase/downloads/index.html]
-
Install JDK.
-
Start IJC, start connecting to schema, let it go frozen.
-
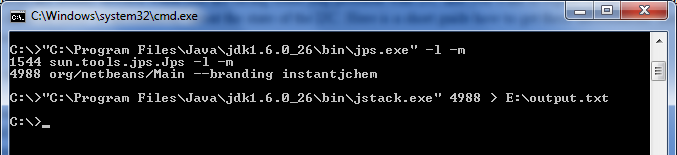
Use this command from installed JDK (it prints current java processes):
bin\jps.exe -l -m -
The output can look for example:
C:\>c:\jdk16\bin\jps -l -m
2440 sun.tools.jps -l -m
4828
The second number is IJC. -
Use the other JDK tool:
bin\jstack 4828
=> it prints all current threads (what IJC is exactly doing).
-
Please send us the output.
IJC is not completely frozen
Something is still running and you can control IJC. The output from tools mentioned above could help us as well, but in this case you can use this:
-
In IJC r-click to toolbar.
-
Switch on the memory toolbar.
-
There will be a memory info chart + new button in toolbar. Use that button ("Take snapshot of thread dump...").
-
Press it once and then after 1 minute press it second time
=> Please send us the file it generates.
SQL logging.
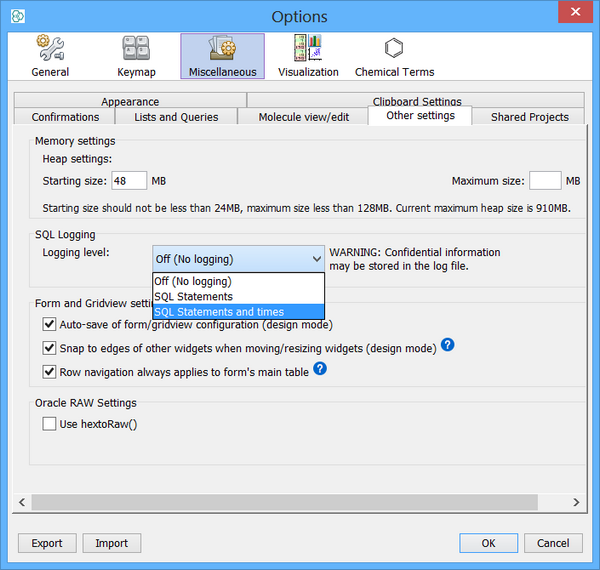
Viewing data in Instant JChem widgets, always involves executing a set of SQL statements that are constructed by IJC based on the data model or set of entities in the datatree. Sometimes and for various reasons, the data set returned might be unexpected, NULL or the SQL very slow to execute, indicating some inherent issue with the generated SQL statement. It is often useful to obtain the SQL statements and check them - the SQL logging options are available to facilitate this. There are now three levels of SQL logging available which are configured by
Tools->Optionsand 'Other Settings' tab - please see the screen shot below. No logging and SQL with and without execution times define the three possible states.
JVM crashes completely
When a fatal error occurs the application crashes completely together with the Java Virtual Machine. In this case an error log is created with information and the state obtained at the time of the fatal error. This file has name hs_err_pid pid .log, where pid is the process ID of the process. Primarily this file will be found in the IJC working directory (eg. C:\Program Files\ChemAxon\InstantJChem ). In the event that the file cannot be created in the working directory (insufficient space, permission problem, or other issue), the file is created in the temporary directory for the operating system (on Windows it is usually C:\Users\ userName \AppData\Local\Temp ). If you can not find the file search for "hs_err_pid*.log", but file is only created when a fatal error occures and JVM crashes.
OutOfMemory error
This error occurs when some procedure requires more memory than the maximum Java heap size memory. It can happen when there is a bug in IJC or when your maximum memory size is too small. Sometimes helps to increase the maximum memory settings. To do this go to Tools -> Options -> Miscellaneous -> Other settings and increase the Maximum memory size. When an OutOfMemory error occurs Java heap diagnostics is written to the dump file. The dump file has the following location: userDir \var\log\heapdump.hprof. This location on Windows can be somewhat like C:\Users\ userName \AppData\Roaming\.instantjchem\ ijcVersion \var\log\heapdump.hprof.