Histogram Widget
Basics
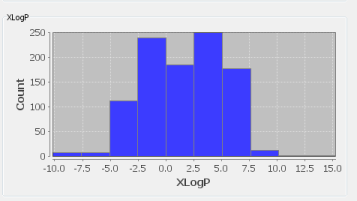
The Histogram chart Widget allows distributions of values to be displayed as a histogram, allowing frequencies of properties such as molecular weight and logP to be displayed.
As well as the distribution of values, those from each 'bin' that are currently selected are distinguished using a different colour. Also, the 'Background' visual layer can also optionally be set to the 'All data' data layer so that the distribution for the current results can be seen within the overall context. Additional information about the context of the data can be obtained by moving the cursor over the bin - the absolute and relative frequency is displayed in the tooltip.
The Histogram chart:
Creating a histogram widget.
Switch to design mode of your form and add a visualisation widget using the visualisation widget icon  . In the first step of the wizard choose Histogram as the widget type.
In the second step of the wizard you need to choose the field that is to be displayed. You also need to choose how the different 'bins' for the X-axis are to be determined (see below). Other settings are optional, and all settings can be adjusted later.
Settings.
To edit the settings in Design mode double click on the Widget and the settings editor will open. In either mode select the widget by single clicking on it and then click on the Widget Settings icon (
) in the Form toolbar. Or alternatively right click on the widget and select Customize Widget Settings item.
Main tab
|
Entity |
Specify the entity the field comes from. Usually this is the parent entity, though it is possible to display a histogram of data from a child entity in which case data in the child entity that corresponds to the currently selected parent row is used for the 'Current data' layer. |
|
Field |
The field whose data is displayed. This is restricted to numeric fields. |
|
X-axis settings |
You can either specify a number of bins (e.g. 10 bins) and the thresholds for those bins will be determined automatically from the data, or you can additionally define the start value and the bin interval (the width of the bin) so that, for molecular weight, you might choose to start at zero and have 20 bins of width 50. When a specific starting point and interval is specified this is always used for the histogram display. When only the number of bins is specified the ranges will be adjusted according to the data (e.g. they may change when you execute a different query). |
|
Y-axis settings |
You can either specify a specific range for the Y-axis or leave this to be determined automatically from the data in which case it may change when you execute a different query. |
|
Axes labels |
These can be manually set if the defaults are not what is needed. |
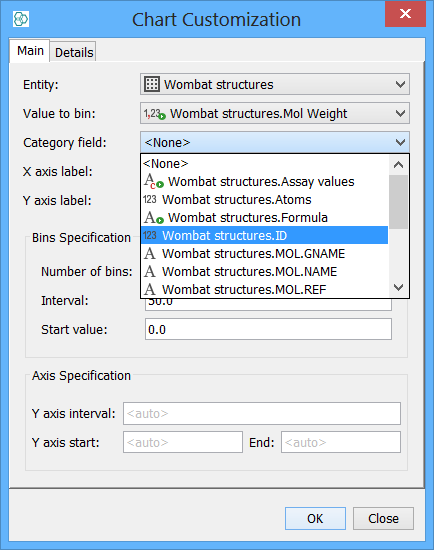
Main customisation dialog:
Category field
-
You can choose to annotate your histogram content with a colour based on a key which is the values found in the assigned category field. Each category will be displayed in a different colour. Colours are automatically assigned. It is wise to use a field which is low cardinality (few distinct values) in order to help show trends & groupings of data. In the example in the screen shot below, we can see a ring count has been applied as the category field. This allows us view the distribution of ring counts over the specified histogram plot.
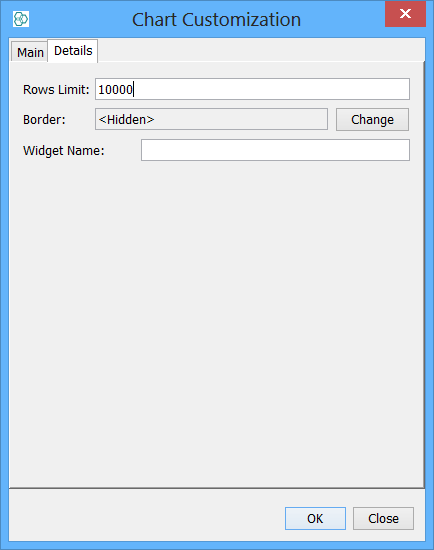
Details tab
Rows limit
-
the limit for the maximum number of points to display. When there are more than this number of points the histogram is not shown. This avoids performance problems when handling very large data sets, or with slow database connections.
Details Customisation dialog:
Details Customisation dialog:
R-click popup menu in browse mode
Zooming
-
The X-axis and Y-axis can be zoomed in or out, or the axes reset to their default ranges using options from the r-click menu.
Data layers
-
You can choose whether to show the 'All data' data layer as the background visual layer.
Image file
-
You can generate a PNG format image, either by copying to the clipboard, or saving to a file.
Performance considerations
Before the histogram can be displayed, the sizes of the different bins needs to be calculated. This involves iterating through the entire set of results, and can be slow if there are a large number of data points or the connection to the database is slow. This means that this widget may not always be suitable for use, or that you might want to consider an appropriate setting for the 'Rows limit' property.
Selection
Bars in the histogram can be selected by clicking on them or dragging out a region with the mouse. Hold Shift for multiple selection. The rows within the selected bar(s) then become selected in other widgets.
Zooming and panning
Histogram can be zoomed by using mouse wheel. Other possibility is to choose the area to zoom in with mouse and keyboard modifier(hold Control and drag mouse). Control of this zooming area is more sophisticated as dragging must start in the upper left corner of a zooming selection and proceed to bottom-right edge. Opposite directions reset to the implicit range.
Panning is done by dragging mouse with pressed mouse wheel or by using Alt modifier and dragging mouse with left button.
Query mode
Histogram widget does not currently support query mode. If you need to be able to query using the field from the histogram then this needs to be added to the form as a normal widget.
Controls
Summary of controls
Dragging == mouse-dragging with left button pressed.
Click == left mouse click.
-
Zoom:
-
Ctrl + dragging from upper-left to bottom-right performs zooms in
-
Ctrl + dragging from bottom-right to upper-left resets zoom
-
Scrolling mouse wheel zooms in/out
-
-
Selection:
-
Click create new selection
-
Shift + click adds/removes to/from selection
-
Dragging create new selection with entities in the selected rectangle
-
Shift + dragging adds to selection entities in the selected rectangle
-
-
Panning:
-
Alt + dragging
-
Middle-button + dragging (no keyboard needed)
-