Browse mode
Introduction
Browse mode is where the form is 'live', allowing you to view and edit data. Before you can do this you need to create the form in Design mode. When you switch to Browse mode the currently selected record (or the first record if there is no selection) will be displayed.
Navigation and Selection - basic overview
Navigation in the Form View is best considered from the perspective of the Entity at the root of the Data Tree. This contains data that could be viewed using a Grid View (in fact this is exactly what happends when you use a Grid view for a complex Data Tree - you just see the data from the root Entity). Navigation and Selection is most easily explained if initially only data from the root Entity is considered (e.g. lets assume this is a simple Data Tree with no child vertices).
When you navigate through the results (the actual results reflect the current query and sort directives) you are effectively stepping through the rows in this root Entity. The navigation arrows in the main toolbar let you navigate forward and back through these rows, and display the current record number.

You can jump to a particular record by clicking in the text box that displays the current selection and typing the record number that you want to go to. e.g. to move to the 123rd record click in the box type 123 and hit the return key.
Note the navigation actions apply to the current selection. In relational forms (see below) this can mean that you are navigating though detail records. To signify this the colour of the navigation arrows change to blue to indicate that you are navigating through detail records.
Lets consider a form that just has a WBTable Widget on it and this table is bound to fields from our root Entity. As you move through the records using the navigation arrows the selected row in the table is updated. Similarly, if you manually select a row from the table the current record number in the navigation toolbar will update. In this type of form you are seeing the data for all the rows in our current ResultSet in the table, just like the Grid View. In fact this type of form behaves identically to the Grid View.
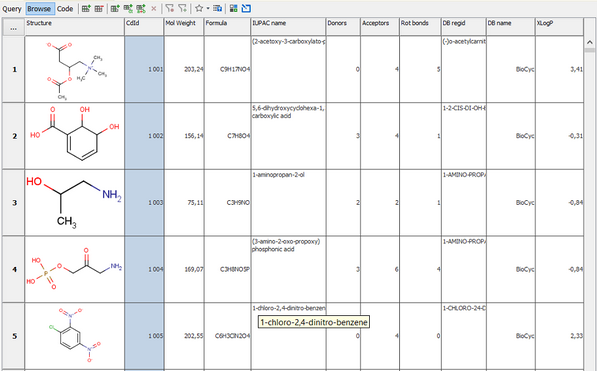
Example 1: Simple form containing a table of the data from the root vertex of the Data Tree. All data is at the same 'level'.
Now consider a different form, one not containing a table but a set of Widgets that display a single item of data from a field. As we navigate through the rows in our ResultSet each Widget updates with the value for the current row. You only see data for a single row at a time, but you now have the whole area of the form available to display this data. As seen below we are displaying more fields more effectively in less space.
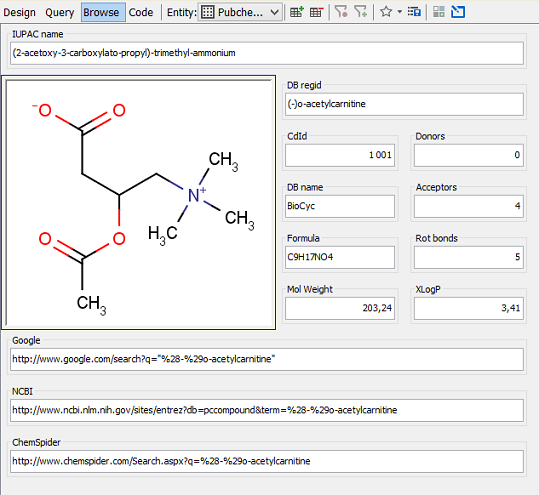
Example 2: Simple form displaying a record by record view of the root vertex of the Data Tree. All data is at the same 'level'.
Are these two approaches mutually exclusive? Well, no, you can have a table and single field Widgets present on the same form and you get the best of both worlds. This is of most use if for instance you basically want a tabular view of your data, but some of the fields needed too much space to display efficiently in a table. Typically this would be the structure field and any text fields that contained large amounts of text or was contained on multiple lines. As seen below we are seeing data from multiple rows displayed in a compact manner in the table, but further details for the currently selected row are also displayed. As the selection changes, either by using the navigation controls or selecting the row in the table, then the details to the right of the table will update appropriately.
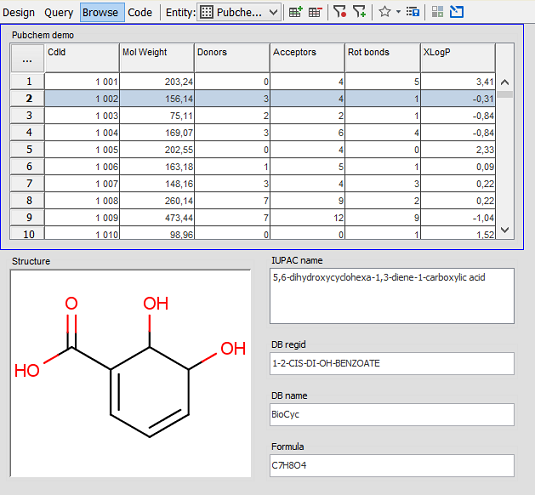
Example 3: A hybrid view mixing features of Example 1 and Example 2 in the same form. All data is at the same 'level'.
Navigation and Selection - relational data
Understanding navigation and selection in relational data follows the same principles outlined in the previous section, but is obviously a little more complex. Before you start on this section make sure you understand the previous section. Re-read it now if necessary.
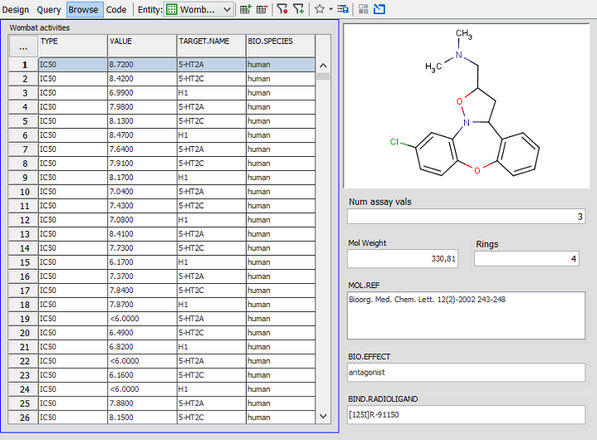
Again it is best to consider navigation and selection from the perspective of the root vertex in the Data Tree. Consider a Data Tree that has an Entity for a JChem structure table as the root vertex, and a child vertex that contains assay results. Probably the most useful way to view this data is using a form that has single field widgets for the structure and its properties, and a Table widget to display the assay results.
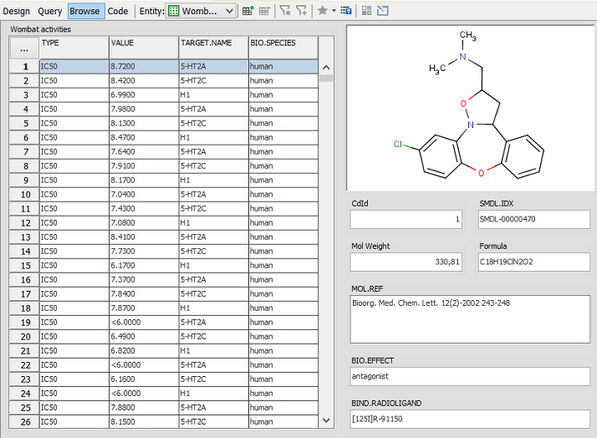
Example 4: Master detail form, similar to Example 2, but with the addition of a table that displays the assay results for the currently selected structure. The data is now at 2 'levels'.
The top half of this form is identical to the one in Example 2, but there is an additional table at the bottom of the form. This is now a master-detail form in which data for each master row (the one for the structure) is displayed on the form and updates as you navigate though the data (similar to Example 2 above), but also on this form is a table that displays the detail data - the assay results for the currently selected row in the master. As the selection in the master changes the assay results in the detail table will update. The number of rows may change, in addition to all the values.
We can now take this a stage further. The detail table behaves just like the table in Example 1 in that you can select rows from it, and that selection will control the data that is displayed with any widgets that are bound to a field in the same vertex, or one that is a vertex that is a direct child of the vertex (defining a second level of master-detail Relationship). To illustrate this we could add another table to the form that displayed data from this second detail level and the data it displays would reflect the selection in the first level detail table.
For another example see Example 5 below, where some fields from the same vertex as the detail table are bound to the widgets beneath the table. The contents of these widgets reflect the currently selected row in the detail table. They contain data that could have been displayed in the detail table, but we chose not to (because they are of lower importance, or would take up too much space). You may also notice that the navigation arrows in the main toolbar have changed colour to indicate that you have selected a record that is not from the entity at the root of the data tree.
Example 5: Master detail form, similar to Example 4, but with the addition of Widgets for further data from the detail level.
Navigation and Selection - sub-selection
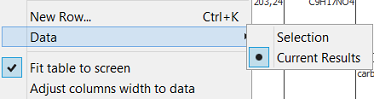
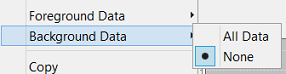
The need of an additional selection concept came up with the visualisation widgets. Imagine that you want to show(e.g. in molecule matrix) only selected structures from a chart. All multi-row widgets can be set to show just a selection. Let's assume that a chart show current results data layer and a molecule matrix shows the selection data layer. You can change data layer in context menu of molecule matrix and chose Data -> Selection. If you select some points in selection, a sub-selection is actually made. There are 3 independent data layers (sets of rows) - current results, selection and sub-selection. The fourth data layer - all data, can be shown only on the background in charts. The higher level always contains all rows presented in lower level. This concept is uniform in all multi-row widgets in the way, that highlighted sub-selection is shown in all widgets set to selection as highlighted points. Selection is highlighted in all widgets set to current results. Single row widgets shows only first row of sub-selection/selection.
In the case of a table and a scatter plot on the form, where scatter plot shows current results and the table shows selection. Selecting points in the scatter plot will automatically update rows shown in the table. Selection made in the table is actually sub-selection and all actions are applied to this sub-selection.
The following actions are applied to selection or sub-selection(depends on widget data bonding):
-
Delete Rows
-
Save as List
-
Cherry Picking
-
Remove row(s) from results
Be aware of the widget which is focused, because this widget decides if the selection or the sub-selection is taken into account when an action is applied.
|
|
|
Editing data
Data in the form can be edited, assuming you have access rights to edit data and the particular field is editable. To edit data double click on the widget and it will either switch to edit mode, allowing you to edit the value in place (e.g. for TextField and TextArea Widgets), or with a popup editor (e.g. for MolPane widgets). A field that is being edited is indicated by by its title changing to red or some other visual symbol. To edit a cell in a table double click on the cell. With in-place editing type in the new value and hit the Return key to commit the change. Hitting the ESC key will cancel the editing and restore the old value.
Note: to edit a TextField or TextArea Widget you need to double click in the actual area that displays the data. If you double click in the surrounding border area you open the settings editor for the Widget, allowing you to edit the display settings.
Adding and deleting records
Adding and deleting rows is done in a very similar manner to the Grid View. There are actions in the Form toolbar for adding and deleting rows which operate in a very similar manner to the Grid View.

The only complication is when it comes to adding and deleting from relational data. Are you wanting to add/delete a row from the master data or the detail data? Both are usually possible, and what you are adding/deleting to/from is determined by the current selection. If you have a detail widget (e.g a table) on the form and it is selected (as indicated by its blue border) then the add/delete actions will act on that vertex (and hence its Entity) to which that Widget is bound. This is further emphasised by the ComboBox in the toolbar that lists the Entities that are present in the Data Tree. ComboBox should display the Entity for the currently selected Widget, and the selection can be changed by using the Combo Box.
With relational data not all additions/deletions are possible, depending on the nature of the relationships between the Entities. Most important is the 'ON DELETE' property of the foreign key constraint. The setting of this parameter controls what happens to the dependent rows when you delete a row from the main table. If set to CASCADE then the dependent rows will also be deleted (and possibly any rows that are dependent on those), which is often what is wanted, but use this option with care! If the option is set to RESTRICT then deletion will not be permitted if there are any dependent rows present. More options may be possible. Consult the documentation for your particular database.
Also pay attention to editing values in relational data where the ordinality from master to detail is many-to-one. You will not only be editing the value for the current record, but also all the others (the many's) that reference that same record (the one). Make sure this is what you want before you do it.
Sorting and Querying
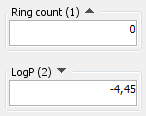
Sorting and querying operate in a similar manner to the Grid View. Sorting can apply to any level in the master-detail hierarchy, and each Entity in the Data Tree can have its own sort directives. Sort directives are indicated in the Table Widget by symbols in the column headers (just like Grid View), whilst for most other Widgets the symbols are displayed in the border for the Widget. The last used sort configuration is remembered per user. The image below shows a form that is sorted first by the Ring count Field in ascending order and then by the LogP Field in descending order.
Query operates identically to Grid View. In Standard Query mode only Fields from the root element of the Data Tree can be included in query criteria. To search using the detail Feilds you must use Advanced Query.
Editing settings
The options for modifying the design of the Form are much more limited in Browse mode compared to Design mode. You can only make changes to which Widgets are present on a Form or their locations in Design mode. But some things are possible in Browse mode:
-
Display settings of the Widgets can be changed. To open the settings editor for a widget either:
-
Double click on its border region
-
Select the Widget and click on the Widget Settings icon (
) in the Form toolbar
-
-
Table settings such as which columns are displayed can be edited using the settings dialog for the table.
-
Columns in a table can be re-sized and re-ordered.
-
Row height in a table can be adjusted.