Isoelectric point (pI) calculation
This background material discusses the theory behind our isoelectric point calculation:
Isoelectric point
The isoelectric point (pI) of a molecule is the pH at which the molecule carries no net charge. Knowing the pI can be important for predicting e.g. the solubility of a molecule at a given pH; predicting the pI for proteins can help in their separation and purification processes.
Predicting the isoelectric point
Molecules with ionizable sites have many microspecies in aqueous solution. (A molecule with N ionizable sites have 2N-1 microspecies; we do not count the natural form here as a microspecies) At a given pH the molecule is present as a set of microspecies with a given distribution, where each microcpecies has a net charge. The total charge can be expressed by the weighted sum of the net charges of the microspecies (let the charge of the i th microspecies be Ci), using the distributions as weights (let the distribution of the i th microspecies be di):
ΣiCidi
The isoelectric point is the pH where this sum is 0, that is
ΣiCidi = 0
Our pI prediction algorithm approaches the (unique) zero point of the total charge function (which is a function of the pH). The pH step-size can be set for the algorithm.
Predicting the isoelectric point for molecules with many ionizable sites is not easy in general as there are many microspecies. The accuracy of the prediction is heavily dependent on the accuracy of the pKa prediction and the pH step size.
Examples
The following examples were calculated with the default settings of the Isoelectric Point Plugin.
Example #1
For amino acids that have just 2 ionizable sites it is easy to predict the pI as there are only 3 microspecies, and 1 of them has 0 net charge. So there are only 2 microspecies (1 with +1 and 1 with -1 charge ) with exactly opposite charges. As the two dissociation constants (the pKa value of the COOH group and the pKb value of the NH2 group) are far away from each other, we get a very simple pH-charge plot.
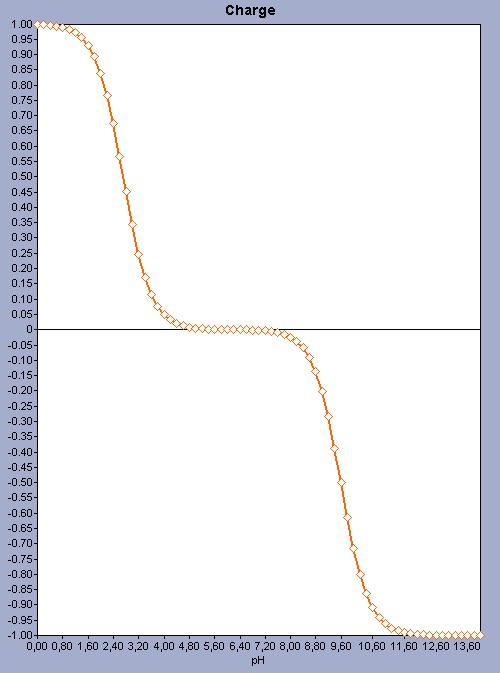
Fig. 1 The pH-charge plot of the amino acid valine with a pI value of 6.16.
Example #2
For molecules that have more ionizable sites the prediction uses the same principles; however the pH-charge plot becomes more complex because of the number of microspecies. See a more complex pH-charge plot for the histidine molecule as an example.
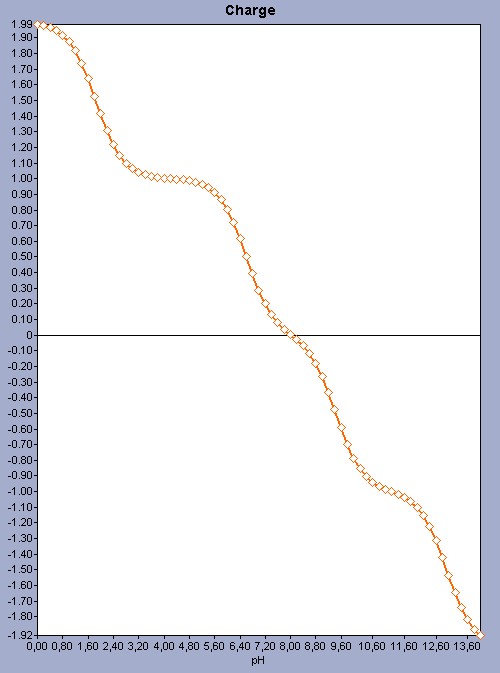
Fig. 2 The pH-charge plot for the histidine molecule showing a more complex plot with a pI 8.02.
Some experimental values
Here is a table with the predicted and experimental pI values for the amino acids. The ChemAxon pI values were calculated with the default setting of the plugin.
|
Amino acid name |
ChemAxon pI value |
|
|
alanine |
5.98 |
6.00 |
|
arginine |
10.77 |
10.76 |
|
asparagine |
5.21 |
5.41 |
|
aspartic acid |
3.41 |
2.77 |
|
cysteine |
5.67 |
5.07 |
|
glutamic acid |
2.79 |
3.22 |
|
glutamine |
5.73 |
5.65 |
|
glycine |
5.78 |
5.97 |
|
histidine |
8.02 |
7.59 |
|
isoleucine |
6.19 |
6.02 |
|
leucine |
6.14 |
5.98 |
|
lysine |
9.82 |
9.74 |
|
methionine |
6.01 |
5.74 |
|
phenylalanine |
5.96 |
5.48 |
|
proline |
7.11 |
6.30 |
|
serine |
5.69 |
5.68 |
|
threonine |
5.60 |
5.60 |
|
thyptophan |
5.97 |
5.89 |
|
tyrosine |
5.51 |
5.66 |
|
valine |
6.15 |
5.96 |