Data Analysis
Plexus Analysis is a tool in the Plexus Suite which provides a solution for analyzing and visualizing chemical data. The first version of the new tool enables visual analysis by plotting data in a histogram or in a multi-dimensional scatter plot.
Data import
The data to be analyzed can come from different sources. You can
-
upload a file (e.g., SDfile, MRV, tab-separated text file);
-
collect data from your corporate database through Plexus Connect.
Analyze data from a file
Plexus Analysis currently supports the import of the following file types: SDfile, MRV (ChemAxon's Marvin document) and SMILES files, as well as tab-separated text files.
The content of an imported file will be visualized in a spreadsheet-like format in a new Analysis workspace. Since each browser tab can contain only one such workspace, imported data from a second file will always appear in a new browser tab.
Analyze data in the company database
You can extract the data from your company database with the help of Plexus Connect and send it to Plexus Analysis, where you create dynamic charts to better understand the possible relationships and correlations behind you data set:
-
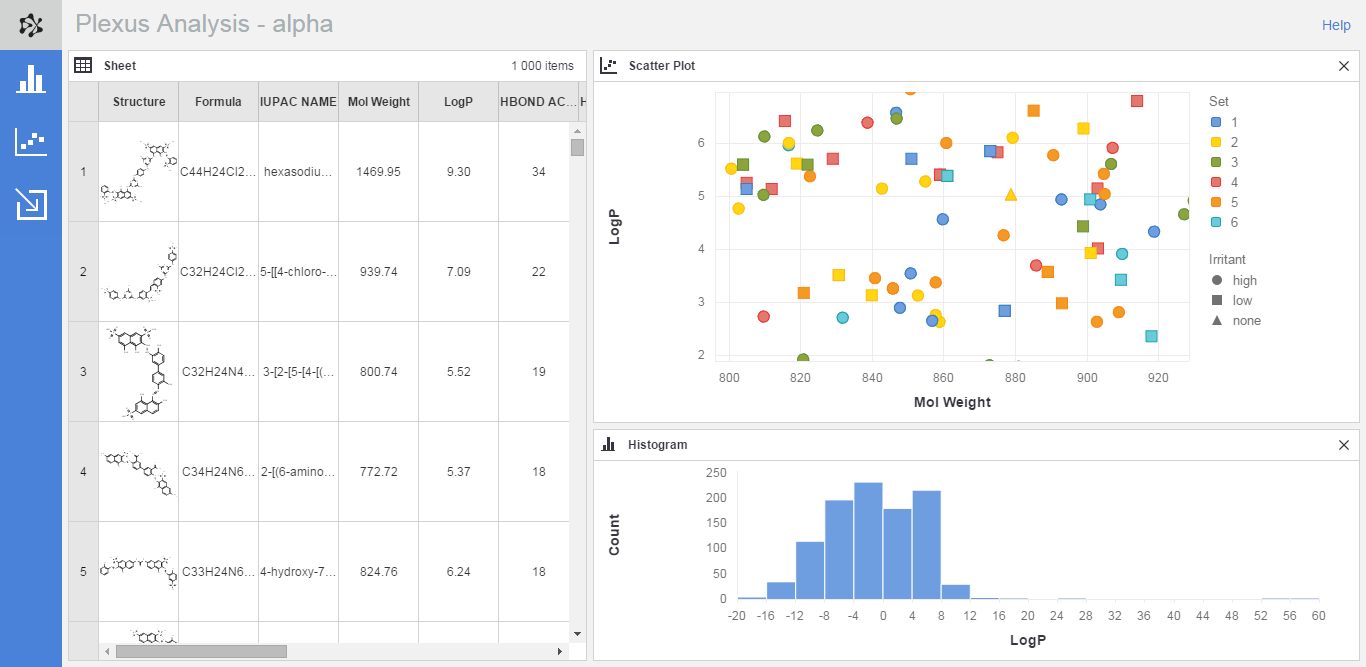
You can visualize the distribution of your chemical data in histograms or
-
you can use scatter plots which can handle up to five dimensions: you can assign a field to X- and Y-axis of the charts, respectively, as well as to the coloring, size and shape of the data points.