NMR Predictor
This manual gives a walk-through on how to use the NMR Predictor:
Introduction
Predicting the NMR spectrum for a chemical compound can play an important role in structure validation and elucidation. The NMR Predictor is a standalone tool that can predict both 1 H and 13 C NMR spectra of organic compounds.
NMR Predictor QuickHelp
The picture below gives a quick overview on the capabilities of ChemAxon's NMR Predictor.
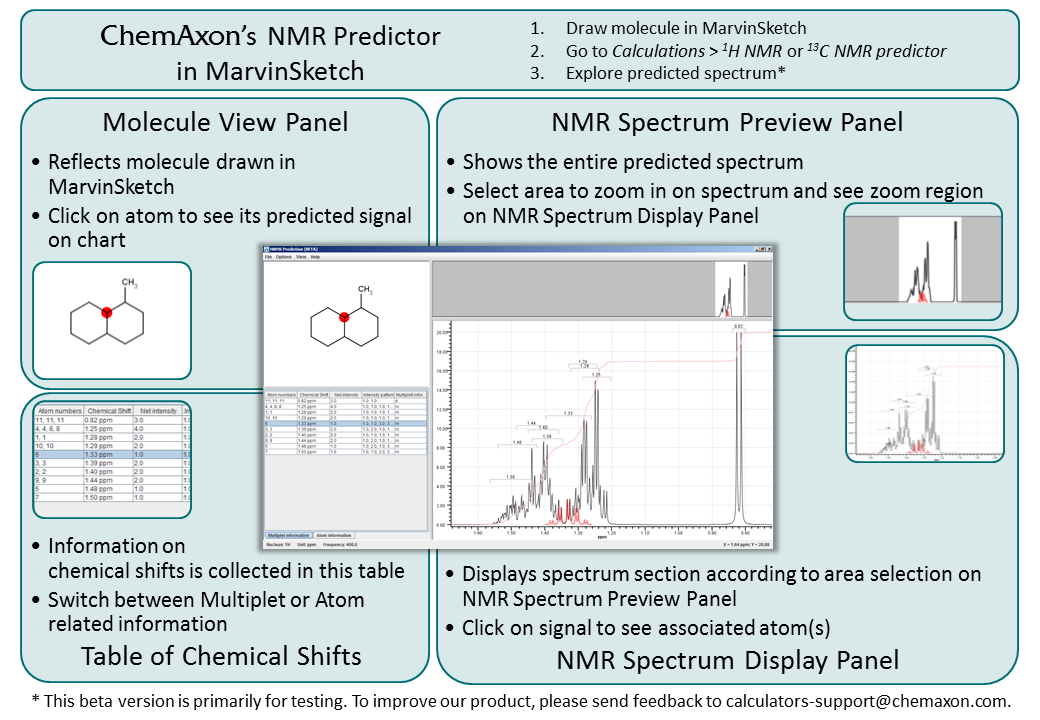
Fig. 1 NMR Predictor QuickHelp
NMR Predictor
Overview
The NMR Predictor application is able to predict NMR spectra for standard organic molecules containing the most frequent atoms (molecules containing H, C, N, O, F, Cl, Br, I, P, S, Si, Se, B, Sn, Ge, Te and As atoms). The chemical shifts are estimated by a mixed HOSE- and linear model based on a topological description scheme and are in relation to the chemical shift of tetramethylsilane (δ(TMS)=0 ppm). 13C and 1H chemical shift training data were retrieved for training from the NMRShift Database. You can read more about the NMR chemical shift model description here.
The NMR Predictor is integrated into MarvinSketch (you can reach it under the Calculations > NMR menu), and contains three components to discover NMR spectra of molecules.
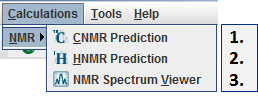
Fig. 2 The Calculations > NMR menu in MarvinSketch and its three components
NMR prediction is also accessible via cxcalc. To get started with the NMR Predictor via cxcalc, use the
cxcalc nmr -h command.
Chemical features
The NMR Predictor has the following basic features:
-
Prediction of 13C and 1H NMR chemical shifts
-
Spin-spin couplings are taken into account according to the first order approximation
-
H-H, H-F and C-F couplings are considered during NMR spectrum calculation
-
Diastereotopic protons are differentiated
-
NMR Spectrum Viewer is able to display NMR spectra in JCAMP-DX format.
GUI features
The NMR Predictor graphical user interface (GUI) has the following features:
-
Export predicted spectrum to MOL file
-
Export predicted spectrum to JCAMP-DX file and/or import JCAMP-DX (*.jdx) reference spectrum
-
Create PDF file as a report of your prediction, containing molecule structure, predicted spectrum, and related tables
-
Detached Copy to clipboard action for all predictor panels and tables is available
-
Update molecule from MarvinSketch;
-
Toggle between decoupled and coupled NMR spectrum
-
 Toggle between explicit and implicit hydrogen display
 -
Select NMR prediction frequency from a predetermined list
-
Add common organic solvent peaks to predicted spectrum
-
Add tautomer peaks to predicted spectrum
-
Restore default NMR predictor settings, e.g. prediction frequency, display and view options
-
Display realistic or line NMR spectra
-
Add atom indices or chemical shift values to signals as spectrum labels
-
Display spectrum scale in ppm or Hz units
-
Show integral curve to assign value to NMR spectrum signals
-
Display legend on spectrum display panel
-
Show local maximum values of reference spectrum
-
Personalize the color management of NMR Predictor
-
Set chart color uniquely
-
When you click on a peak on spectrum display panel or on an atom on molecule preview panel, selection will move to and zoom in on the selected signal
-
Choose multiplet selection mode: individual selection in case of overlapping multiplets is available
-
Use various modes of zoom in on spectrum
-
Find spectrum and molecule structure related information in Atom, Multiplet, and Coupling tables
-
Show atom indices on molecule structure corresponding to the different multiplets
Atoms of the input molecule and multiplets of the NMR spectrum are linked together. Upon selection of an atom the corresponding multiplet is highlighted and vice versa. A single NMR prediction is allowed to contain more molecules.
Usage
You can predict 13C NMR and 1H NMR spectra of organic molecules drawn in MarvinSketch using the Calculations > NMR menu:
-
Draw molecule in MarvinSketch.
-
Go to Calculations > NMR > and choose
-
CNMR Prediction to discover the predicted 13C NMR spectrum of the molecule, or
-
HNMR Prediction to discover the predicted 1H NMR spectrum of the molecule.
-
-
The predicted spectrum will open in CNMR Prediction window if you chose CNMR Prediction, and in HNMR Prediction window if you chose HNMR Prediction, respectively.
You can predict both spectra of the molecule in question, which will appear in separate windows.
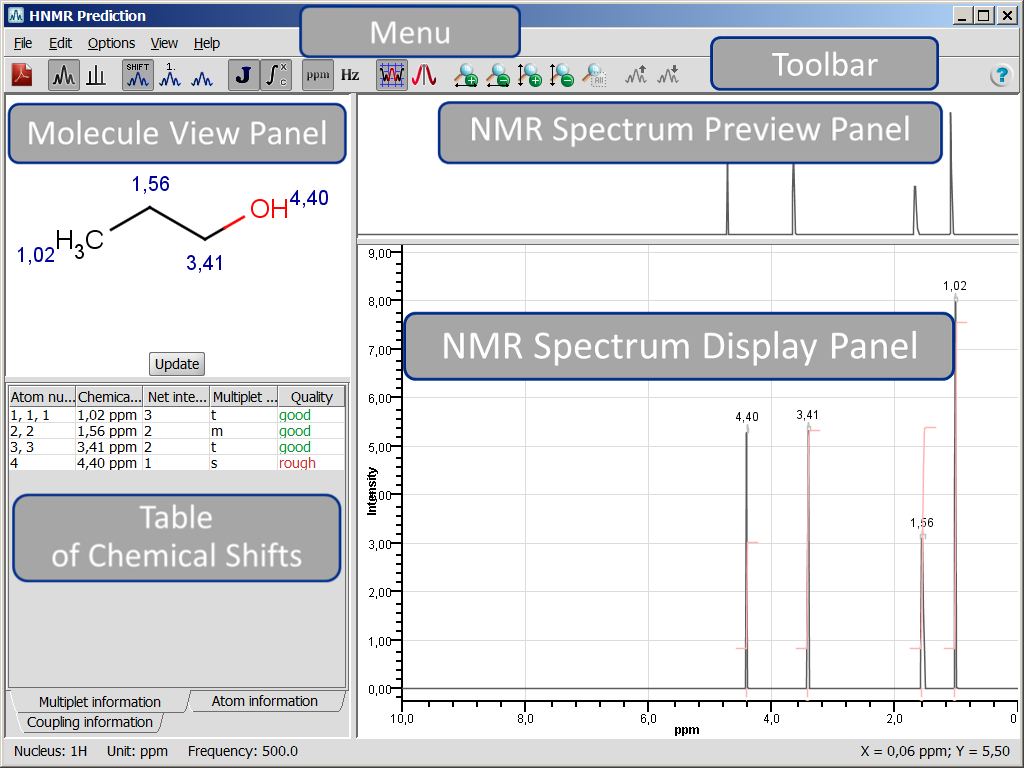
Fig. 3 HNMR Prediction result window and its parts
Both NMR Prediction windows consist of a menu, toolbar, and four panels. The name of the window is displayed at the top left corner. At the bottom left corner of the status bar general information on the NMR prediction is shown, i.e. nucleus, measurement unit and prediction frequency. At the bottom right corner the coordinates of mouse cursor position on the NMR Spectrum Display Panel are shown.
Menu elements and panels of both 13C and 1H NMR Prediction windows are discussed together. Differences will be marked by the appropriate icon ( ![]() for CNMR Prediction,
for CNMR Prediction, ![]() for HNMR Prediction).
for HNMR Prediction).
Menu system
The menu system contains File, Edit, Options, View and Help menus.
File menu
The File menu can be used to export spectra to files; to import spectrum of JCAMP-DX file format and superimpose it on predicted NMR spectrum; to remove the imported spectrum and to close the NMR Prediction result window.
-
File >
 Export to PDF...: exports the molecule structure, predicted spectrum (full), and related tables to PDF file. You can select Keep view settings option on the export dialog panel to keep the actual view of spectrum during export.
 -
File > Export to JCAMP-DX...: exports predicted spectrum to JCAMP-DX (jdx) file format.
-
File > Export to Molfile...: exports predicted spectrum to MOL format. You can export the predicted spectrum data to SDF file format. The SDF file will contain structure and NMR Spectrum fields. The NMR Spectrum field contains the relevant atom number (AN), value of chemical shift (vδ), unit of chemical shift (uδ), and multiplicity of the signal (M) in the following format:
vδ1;uδ1,M1;AN1|vδ2;uδ2,M2;AN2|...|vδi;uδi,Mi;ANi.
-
File > Import from JCAMP-DX: imports a spectrum in JCAMP-DX format. The imported spectrum will be superimposed on the predicted NMR spectrum.
-
File > Remove Imported Spectrum: removes previously imported JCAMP-DX spectrum from NMR Spectrum Display Panel.
-
File > Exit: closes NMR Prediction window.
Options menu
The Options menu can be used to set optional NMR prediction settings:
-
Options >
 Spin-Spin Coupling: prediction considers spin-spin coupling; the result is splitting of signals into multiplets according to the interaction between two nuclei.
 -
Options >
Implicit Hydrogen Mode: hydrogens are displayed only on hetero and terminal atoms.
Note If you switch off this mode:-
all hydrogens will be visible on Molecule View Panel;
-
atoms will be re-numbered on all corresponding panels;
-
coupling table will be filled in with relevant data.
-
-
Options > NMR Prediction Frequency: sets the frequency of the NMR prediction. Select prediction frequency from the predetermined list. Prediction frequency influences the fine structure of the spectrum.
-
Options > Add Solvent Peaks...: Adds NMR signal(s) of selected common organic solvent(s) to the predicted spectrum. Select solvents from the predetermined list and click OK. The signal(s) of selected solvent(s) will be added to the predicted spectrum. When spectrum labels are displayed, you can see the name of the solvent attached to the corresponding signal. We used the NMR shift data of common organic solvents in CDCl3 collected by Gottlieb et al.
-
Options > Select Tautomers...: opens a dialog where tautomers of the relevant molecule are displayed. The major tautomer is automatically selected. The values of tautomer distributions are obtained from MarvinSketch's Dominant tautomer distribution calculation. You can select altogether 8 tautomers to add their signal(s) to the predicted spectrum. Check the upper right check box of the appropriate tautomer. The distribution of each tautomer has to be set before proceeding. When spectrum labels are displayed, the corresponding signals of the active tautomer can be seen on Spectrum Display Panel, while the tautomer peaks are signed according to their symbols.
-
Options > Clear Tautomers: removes all selected tautomer peaks from predicted spectrum.
-
Options > Reset Default Settings: resets zoom and the default Options, Color, and View settings of NMR predictor. This is for
-
CNMR Predictor:
-
NMR Prediction Frequency: 500 [125] MHz
-
Spectrum Display: Realistic Spectrum
-
Spectrum Labels: Chemical Shifts
-
Measurement Unit: ppm
-
Zoom Follows Selection: On
-
-
HNMR Predictor:
-
Spin-Spin Coupling: On
-
Implicit Hydrogen Mode: On
-
NMR Prediction Frequency: 500 MHz
-
Spectrum Display: Realistic Spectrum
-
Spectrum Labels: Chemical Shifts
-
Measurement Unit: ppm
-
Integral Curve: On
-
Zoom Follows Selection: On
-
-
Examples
Example #1
Toggle Spin-Spin Coupling: choose Options > Spin-Spin Coupling
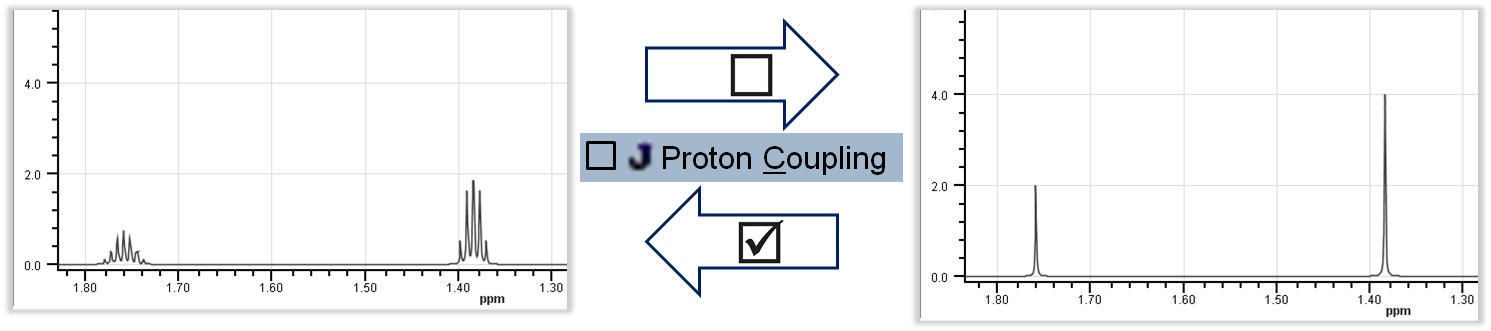
Fig. 4 Spin-Spin coupling option effect on the prediction results
Example #2
Toggle Implicit Hydrogen Mode: choose Options > Implicit Hydrogen Mode
Change default setting to: View > Spectrum Labels > Atom Numbers; Zoom in on the certain spectrum region.
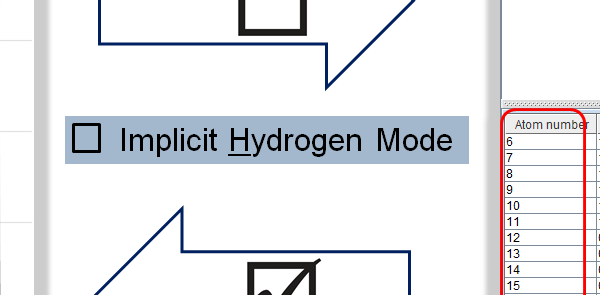
Fig. 5 Implicit Hydrogen Mode effect on the prediction
View menu
It is to select different display options related to the predicted spectrum and the molecule structure:
-
View > Spectrum Display:
-
 Realistic Spectrum: displays predicted spectrum in a realistic way.
 -
 Line Spectrum: predicted chemical shifts are presented by distinct lines with proper intensity.
-
-
View > Spectrum Labels: In order to assign signals and relevant atoms more easily, you can display the atom numbers or the chemical shift values of each signal on the NMR Spectrum Display an Molecule View Panels. Select:
-
 Atom Numbers to see atoms assigned to each signal and to display atom numbers on Molecule View Panel as well.
 -
Chemical Shifts to see the exact chemical shift value of NMR signals on the NMR Spectrum Display Panel.
-
 None to remove spectrum labels.
Note that you can display only one type of label at a time.
-
-
View > Measurement Unit: the chemical shift of tetramethylsilane (TMS) is set to zero, and all other chemical shifts are predicted relative to it. The unit of display can be:
-
 Hz or
Hz or -
 ppm.
ppm.
-
-
View >
 Integral Curve: displays integral curve on spectrum. Default setting is on
.
Integral Curve: displays integral curve on spectrum. Default setting is on
.
-
View > Display Legend: displays legend on Spectrum Display Panel. The legend contains information on different functions of Spectrum Display Panel.
-
View > Reference Spectrum: It is an imported JCAMP-DX NMR spectrum that can be superimposed on the predicted NMR spectrum.
-
Display Shifts: If the imported JCAMP-DX file has "PEAKTABLE" property, the chemical shifts of the imported spectrum can be displayed.
-
None: Remove chemical shift labels of the reference spectrum. View > Set Colors...: you can customize the color of the predicted spectrum, reference spectrum and selection.
-
-
View >
 Zoom Follows Selection: If you select an exact atom on Molecule View Panel, or a signal on NMR Spectrum Display Panel, the appropriate signal is centered and zoomed in on NMR Spectrum Display Panel.
 -
View >
 Select Individual Multiplets: In case of overlapping multiplets, this option enables highlighting individual multiplets.
 -
View >
 Horizontal Zoom In: zooms in on spectrum in X-axis direction.
 -
View >
 Horizontal Zoom Out: zooms out of spectrum in X-axis direction.
 -
View >
 Vertical Zoom In: zooms in on spectrum in Y-axis direction. Note that the bottom of the selection window is fixed.
 -
View >
 Vertical Zoom Out: zooms out of spectrum in Y-axis direction. Note that the bottom of the selection window is fixed.
 -
View >
 Reset Zoom: displays the whole spectrum in both directions.
 -
View >
 Scale Up Reference: increases intensity of imported reference spectrum. Active when reference spectrum is imported.
 -
View >
 Scale Down Reference: decreases intensity of imported reference spectrum. Active when reference spectrum is imported.
Examples
Selecting individual multiplets
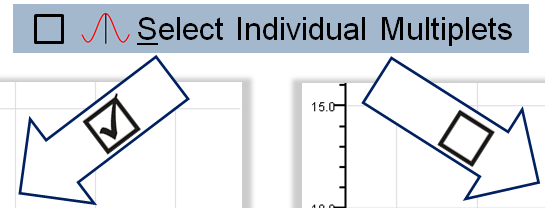
Fig. 6 Selecting individual multiplets
Help menu
There are two menu points that can help you get started with the NMR Predictor:
-
Help >
 Quick Help
 -
Help > Help Contents
Toolbar
You can use toolbar elements to access selected NMR Predictor menu items:
|
|
|
|
|
Export to PDF... |
|
|
Spectrum Display |
|
|
Spectrum Labels |
|
|
Spin-Spin Coupling |
|
|
Integral Curve |
|
|
Measurement Unit |
|
|
Zoom Follows Selection |
|
|
Select Individual Multiplets |
|
|
Horizontal Zoom In |
|
|
Horizontal Zoom Out |
|
|
Vertical Zoom In |
|
|
Vertical Zoom Out |
|
|
Reset Zoom |
|
|
Scale Up Reference |
|
|
Scale Down Reference |
|
|
Quick Help |


Fig. 7 Toolbar elements of the NMR Predictor
Panels
NMR Prediction window contains the Molecule View Panel, the Table of Chemical Shifts, the NMR Spectrum Preview Panel and the NMR Spectrum Display Panel to present the predicted spectrum and to display selected features.
Molecule View Panel
The Molecule View Panel displays the molecule that has to be drawn in MarvinSketch. Using the Ctrl button while the cursor is located in this panel, the view of molecule can be controlled:
-
Ctrl+Mouse scroll button zooms in/out on to the molecule
-
Ctrl+Mouse dragging moves the molecule
If you select
View
>
Spectrum Labels
>
Atom Numbers
, atom numbers will appear on both the
Molecule View Panel
and the
NMR Spectrum Display Panel
.
If you select
View
>
Spectrum Labels
>
Chemical Shifts
, chemical shift values of predicted multiplets will appear on both the
Molecule View Panel
and the
NMR Spectrum Display Panel.
If you have added tautomers to the predicted spectrum via the Select Tautomers... option, the layout of Molecule View Panel will change: the active tautomer is displayed on the panel. To go to the next/previous tautomer, click on the arrows next to the molecule.
In the picture below symbols T1, T2, ..., T n , mark the selected tautomers. Hover over to see tautomer structure in a pop-up window. Click on the symbol to make it active.
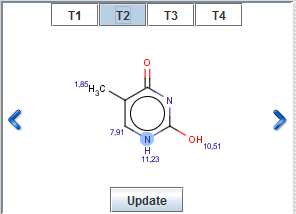
Fig. 8 Molecule View Panel with tautomer windows
Click on the Update button after you have made any modifications on molecular structure in MarvinSketch and you want to predict the NMR spectrum of the new molecule. The effect is equal to using the Edit > Update Molecule action.
Table of Chemical Shifts
The following tabs are available on this panel: Multiplet information, Atom information and Coupling information tabs.Table on all tabs contains data of the predicted spectrum in Multiplet or Atom point of view. Coupling table contains the calculated coupling constants when the Spin-Spin coupling option is selected.
Multiplet information table has six columns, namely: Atom numbers, Chemical shift, Net intensity, Intensity pattern, Multiplet information, and Quality. You can sort data according to these columns.
-
Atom numbers are the numbers displayed on the molecule structure and are assigned automatically.
-
Chemical shift values are displayed in the selected Measurement Unit.
-
Net intensity is the integration value of the relevant signal.
-
Intensity pattern describes the relative intensity of the multiplet elements.
-
Multiplet information is the conventional one letter abbreviation of multiplicity, e.g.: s - singlet; d - doublet; t - triplet; ...
-
Quality defines the prediction quality according to our validation method. Definitions: good, medium, rough.
Atom information table has five columns, namely: Atom number, Chemical shift, Net intensity, Multiplet information, and Quality.
-
Atom numbers are the numbers displayed on the molecule structure and are assigned automatically.
-
Chemical shift values are displayed in the selected Measurement Unit.
-
Net intensity is the integration value of the relevant signal.
-
Multiplet information is the conventional one letter abbreviation of multiplicity, e.g.: s - singlet; d - doublet; t - triplet; ...
-
Quality defines the prediction quality according to our validation method. Definitions: good, medium, rough.
Coupling information table has four columns, namely: Atom 1, Atom 2, Value, and Quality.
-
Atom 1 and Atom 2 are the number of atoms that the coupling constant is connected to.
-
The value of the coupling constant is displayed in Hz.
-
Quality defines the prediction quality according to our validation method. Definitions: good, medium, rough.
NMR Spectrum Preview Panel
The NMR Spectrum Preview Panel displays the whole predicted spectrum. You can zoom in and out on spectrum by using your mouse, toolbar zoom items or menu items:
-
If you want to zoom in on specific region of the spectrum, use left-click and drag on NMR Spectrum Preview Panel. The background of the selected region will turn to white, while unselected region of the spectrum will turn to grey.
-
You can move the selection window by left-clicking into the middle of the selection window; hold mouse button while moving the selection, and release button to place it.
-
You can resize the selection window if you grab-and-drag its yellow side frames (except bottom frame).
NMR Spectrum Display Panel
The NMR Spectrum Display Panel displays the appropriate zoom region of the spectrum of the molecule presented on Molecule View Panel. Move your mouse pointer over the NMR Spectrum Display Panel and use mouse-wheel to zoom in and out on NMR spectrum along the X-axis.
Using Ctrl+mouse-wheel will zoom in and out on NMR spectrum along the Y-axis.
If you have added tautomers to the predicted spectrum via Select Tautomers... option and Spectrum Labels are on, the inactive tautomer signals are marked according to their symbols (T1, T2, ...).
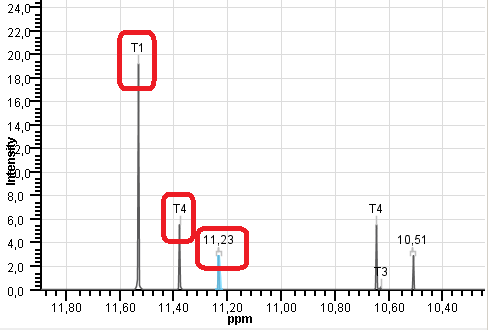
Fig. 9 NMR Spectrum Display Panel with tautomers
NMR Prediction pop-up menu
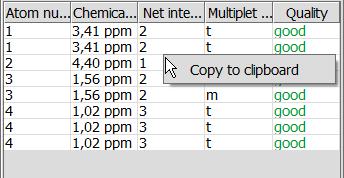
Fig. 10 NMR Prediction pop-up menu
Right-clicking on any panel pops up a menu with the following element:
-
Copy to clipboard: the panel in question will be copied to the clipboard.
NMR Spectrum Viewer
The NMR Spectrum Viewer is part of the NMR Calculation group. It is able to display Nuclear Magnetic Resonance spectra saved in JCAMP-DX format (*.jdx). The opened spectrum can be zoomed in, exported to PDF, or simply copy-pasted as an image. The NMR Spectrum Viewer window consists of a menu, toolbar, two panels, and a status bar.
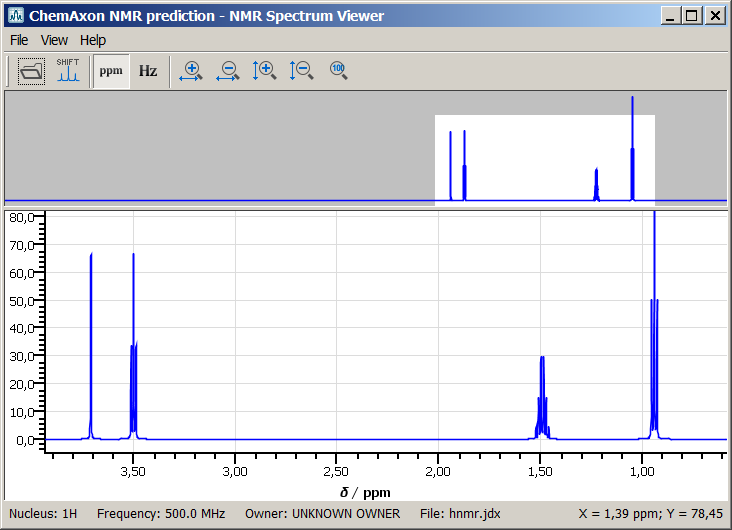
Fig. 11 The NMR Spectrum Viewer
Menu system
The Menu contains
File
,
View
, and
Help
items.
File menu
-
File >
 Import from JCAMP-DX...: opens an NMR Spectrum in JCAMP-DX format to display it in NMR Spectrum Viewer. Clicking on this menu item will launch the Open dialog window. Select an NMR spectrum in JCAMP-DX format and click on Open.
 -
File > Exit: closes the application.
View menu
-
View > Measurement Unit: displays NMR spectrum in one of the following units:
-
Hz or;
-
ppm.
-
-
View >
 Display Local Maximum Places: NMR Spectrum Viewer can display local maximum places as spectrum labels when the JCAMP-DX file contains PEAKTABLE information.
 -
View >
Horizontal Zoom In: zooms in on NMR Spectrum along the X-axis. -
View >
Horizontal Zoom Out: zooms out on NMR Spectrum along the X-axis. -
View >
Vertical Zoom In: zooms in on the NMR Spectrum along the Y-axis. -
View >
Vertical Zoom Out: zooms out on the NMR Spectrum along the Y-axis. -
View >
Reset Zoom: restores the spectrum zooming to full spectrum view.
Help
-
Help > Help Contents: opens the help page in your browser.
Toolbar
You can use toolbar elements to access selected NMR Spectrum Viewer menu items.
|
|
|
|
|
Import from JCAMP-DX... |
|
|
Display Local Maximum Places |
|
|
Measurement Unit |
|
|
Horizontal Zoom In |
|
|
Horizontal Zoom Out |
|
|
Vertical Zoom In |
|
|
Vertical Zoom Out |
|
|
Reset Zoom |


Fig. 12 Toolbar elements
Panels
Panels can be copied separately as images by right-clicking on the appropriate panel and selecting Copy to clipboard action.
Spectrum View Panel
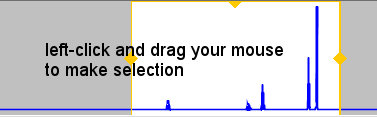
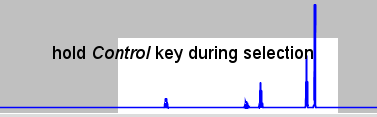
Fig. 13 The Spectrum View Panel
The Spectrum View Panel displays the whole imported spectrum.
-
If you want to zoom in on specific region of the spectrum, use left-click and drag or ctrl + left-click and drag on the NMR Spectrum Preview Panel. The background of the selected region will be highlighted in white, while unselected region of the spectrum will turn to grey.
-
You can move the selection window by left-clicking into the middle of the selection; hold mouse button while moving the selection, and release button to place it.
-
You can resize the selection window if you grab-and-drag the yellow side frame around the highlighted area.
Spectrum Display Panel
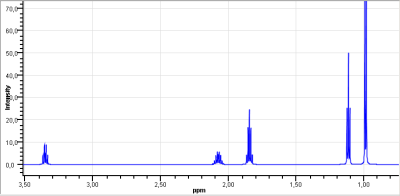
Fig. 14 The Spectrum Display Panel
The Spectrum Display Panel displays the appropriate zoom region of the spectrum. Move your mouse pointer over the NMR Spectrum Display Panel and use mouse-wheel to zoom in and out horizontally, Ctrl+mouse-wheel to zoom in and out verically on the NMR spectrum.
Status bar
The status bar of NMR Spectrum Viewer displays the X and Y coordinates of mouse cursor position, and the following data get stored in the opened in a JCAMP-DX file:
-
Nucleus;
-
Frequency,
-
Owner;
-
File.

Fig. 15 The NMR Viewer status bar
NMR Spectrum Viewer Pop-up Menu
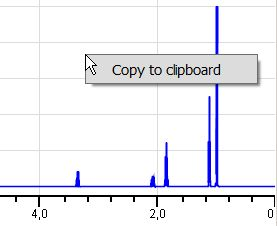
Fig. 15 Copy to clipboard action in the NMR Spectrum Viewer panel
Right-clicking on any panel pops up a menu with the following element:
-
Copy to clipboard: The panel in question will be copied to the clipboard.