pKa Plugin
This manual gives you a walk-through on how to use the pKa Plugin:
Introduction
Most molecules contain some specific functional groups likely to lose or gain proton(s) under specific circumstances. Each equilibrium between the protonated and deprotonated forms of the molecule can be described with a constant value called pKa. The pKa Plugin calculates the pKa values of the molecule based on its partial charge distribution.
Calculation results are shown in a result window with the pKa values displayed next to the corresponding functional group in a red & blue representation. For the explanation about the red & blue colour representation read this document. When the Show distribution chart option is enabled, the distribution of the major microspecies is also displayed in a separate chart.
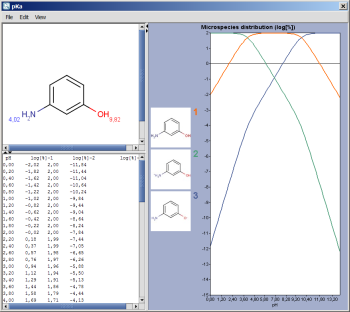
Fig. 1 pKa Plugin window showing the calculated pKa values and the logarithm of the microspecies distribution
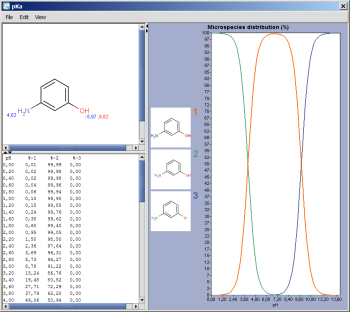
Fig. 2 pKa Plugin winidow showing the calculated pKa values with the microspecies distribution
On species distribution
If there are 8 or less ionizable atoms in the molecule, microspecies distribution is displayed on the chart. Otherwise macrospecies distribution is shown. Images of microspecies are displayed only on the microspecies distribution chart.On macrospecies distribution chart the formal charges of the macrospecies are shown. Hovering the mouse on one of the microspecies images, the corresponding coordinates appear on the chart curve.
Options
General Options
The General Options tab offers the following calculation options to set:
-
Mode: micro, macro: micro and macro acidic dissociation constants. Read details here.
-
Acid/base prefix:
-
static: submitted ionic forms are converted to their neutral forms (adding or removing protons) and their pKa is calculated.
-
dynamic: the pKa of ionic forms are calculated, not their conjugated acids or bases.
-
-
Min basic pKa: widens the calculation range because weak bases will have lower pKa values than the default -2.
-
Max acidic pKa: widens the calculation range because weak acids will have higher pKa values than the default 16.
-
Temperature: setting the temperature in Kelvin.
-
Correction library
-
Use correction library: check this box to use a file with experimental data for the calculation. See the detailed guide for training data setup.
-
-
Consider tautomerization: checking this option, the most feasible tautomer and resonance structures are considered as subject of the pKa calculation.
-
Show distribution chart: checking this box, you will have microspecies/macrospecies distribution as function of pH calculated and displayed. Go to Display Options tab for further settings of the distribution chart. Unchecking this box, only the pKa of the drawn molecule will be calculated.
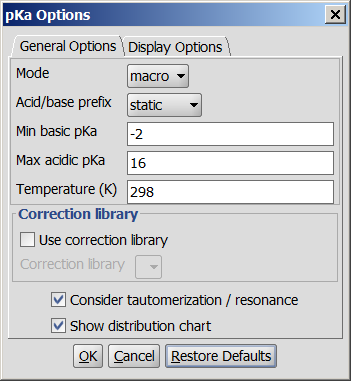
Fig. 3 General Options tab in the pKa Options window
Calculating with the option Consider tautomerization/resonance gives the same pKa values for different tautomers.
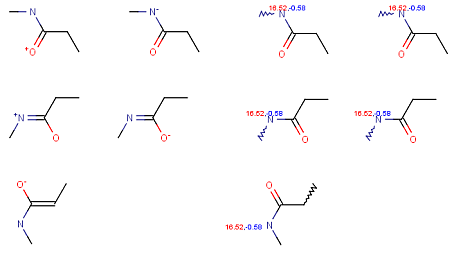
Fig. 4 Calculation results from different tautomers shows that using the Consider tautomerization/resonance option gives the same pKa values for different tautomers
Display Options
The Display Options tab offers the following display options to set:
-
Decimal places: setting the number of decimal places for the result.
-
Distribution chart: you can set the range of displaying the microspecies distribution diagram.
-
pH lower limit
-
pH upper limit
-
pH step size
-
-
Show log[%] - pH distribution: if checked, the common logarithm of microspecies/macrospecies distribution is calculated and displayed as a function of pH.
-
log[%] - pH distribution lower limit: you can set the lower value of the Y axis ranging from -35 to zero.
-
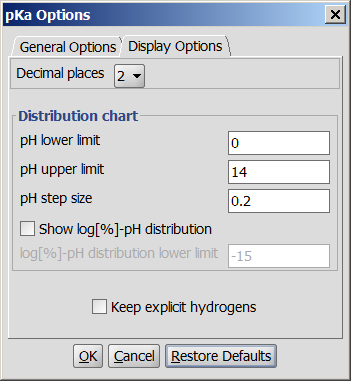
Fig. 5 Display Options in the pKa Options window