ScreenMD
This manual gives you a walk-through on how to use the ScreenMD command line tool:
Introduction
ScreenMD performs fast virtual screening of large compound libraries using molecular descriptor sets. Virtual screening aims to find compounds that exhibit required chemical, structural, pharmacological or other properties. Such properties are represented as molecular descriptor sets and these descriptor sets are compared against each other by calculating a dissimilarity score between them. Thus the goal of the screening procedure is often expressed as an allowed maximal dissimilarity score: structures with a dissimilarity score below such predefined threshold are accepted by the screening process, while others are rejected.
Both file and database inputs are supported, and in either case molecular structures or molecular descriptor sets (generated by GenerateMD) are accepted on input.
The output of the screening application is either a table of dissimilarity coefficients or an SDfile. The table contains the dissimilarity coefficients of the hit set, while SDfile output contains the hit molecules along with all original tags and new ones storing the dissimilarity coefficients.
ScreenMD takes two input sources, target structures and query structures. These structures, or strictly speaking their corresponding descriptor sets are compared in a pair-wise manner. It is assumed that there are significantly more target structures/descriptors than queries, for instance a few million targets can easily be handled, while normally the number of queries should not exceed few times 10.
Target structures/descriptors usually belong to a compound library with pharmacological or biological interest, while queries define the required properties the compound library is sought for. Queries are often referred to as known actives and the aim of the screening exercise is to find other structures in the target set that exhibit the same chemical, pharmacological or biological activity (e.g. they bind to the same receptor protein).
It is reasonable to suppose that compounds with the same activity share common patterns in their corresponding descriptors. These common patterns can be represented by a hypothesis, which can be regarded as a model active structure (or the model of the active site of a receptor). The target library can be scanned for structures matching this hypothesis in contrast to individual query structures. The use of the hypothesis in the screening procedure not only increases the number of hits but also facilitates the more efficient scanning of the target library, since instead of several query descriptor sets (one corresponding to each known active compound) only one descriptor set has to be used.
Descriptors offer a simple yet feasible way to create such models. A usual approach, adopted in ScreenMD too, is to calculate the intersection (common part) of query descriptors. This can be defined as the minimum of corresponding descriptor cells. ScreenMD provides further alternatives to create pharmacophore hypotheses, for instance the average of query fingerprints can also be used. Another possibility is to use the median hypothesis. In this case the median of non-zero values in the corresponding descriptor cells is taken, if the percentage of corresponding zero cells is lower, then a given threshold. If the percentage of zeros is higher, then the corresponding hypothesis cell is set to zero.
Dissimilarity metrics
The comparison of two descriptors involves the calculation of one or more dissimilarity coefficients using dissimilarity metrics. At present the following metrics are supported: Tanimoto and Euclidean.
Values of these metrics are non-negative numbers. A zero dissimilarity value indicates that the two descriptors are identical, and the larger the value of the dissimilarity coefficient the bigger the difference between the the two structures is.
Tanimoto Dissimilarity metrics
In its original form, Tanimoto metrics can be applied to binary fingerprints and it is a similarity metric:
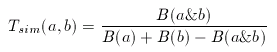
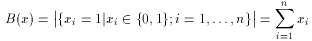
where a and b are two binary fingerprints, & denotes binary bit-wise and-operator, | denotes binary bit-wise or-operator and B( x ) is the number of 1 bits in any binary fingerprint x:
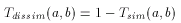
The larger the number of common bits in a and b are, the larger the value of T. Therefore larger values represent higher similarity between a and b, 1 is total similarity, when the two descriptors are the same, while 0 represents the absolute dissimilarity. From that it is straightforward to obtain a dissimilarity measure:
However, extending binary Tanimoto dissimilarity to Molecular Descriptors other than binary fingerprints is less obvious.
Tanimoto for integer valued descriptors
The idea is to represent an integer value as a unary number, that is, replace it by as many 1 bits as its value is. This can be extended to a binary fingerprint by adding leading zeros to the series of 1 so as to make the length of all series the same. This way a binary fingerprint is generated and the original Tanimoto metric can be applied to it. For example the series 13, 4, 7, 9 can be represented as unary numbers as follows:
1111111111111, 1111, 1111111, 111111111
The binary form is:
1111111111111, 0000000001111, 0000001111111, 0000111111111
which can simple be written as a binary fingerprint:
1111111111111000000000111100000011111110000111111111
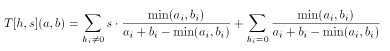
for which applying Tanimoto is simple. With the above consideration in mind, Tanimoto can be rewritten for integer valued descriptor in the form below:

Scaled Tanimoto metric for fingerprints
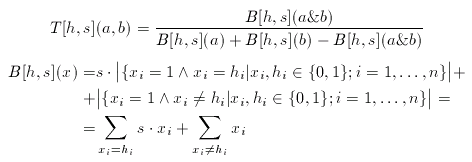
According to published results the selectivity of the binary Tanimoto dissimilarity metric can be improved by scaling. Scaling, however, is feasible only when several compounds exhibiting the same pharmacological activity are known. A consensus fingerprint is created from the descriptors of these known actives:

where a1,...,ana are the known actives. The consensus fingerprint is applied to accentuate both similarities and dissimilarities between a target compound and a query structure (which, apparently should not be involved in the construction of the hypothesis). Non-zero bits of the hypothesis scale the corresponding bits of the target and the query fingerprint:
The scale factor(s) is an arbitrary integer between 1 and 10 (larger values than 10 rarely improve the hits).
Scaled Tanimoto metric for integer descriptors
The extended Tanimoto formula for integer valued descriptors can be combined with the scaled Tanimoto metric in a natural way:
Asymmetric Tanimoto metric for integer descriptors
Pharmacophore hypotheses offer a sophisticated approach to improve the selectivity and efficiency of screening. Yet, they suffer from an apparent deficiency when used in ordinary Euclidean or Tanimoto or other dissimilarity calculation based on a symmetrical metric. Asymmetrical metrics are sometimes mentioned as directed metrics too.
Imagine two descriptors, both at the same distance from a hypothesis, but on different "sides" of it. That is, one is 'smaller' while the other is 'larger' than the hypothesis, component-wise. In this case the dissimilarity values are exactly the same, however, the 'smaller' descriptor can be considered as one that does not satisfy requirements set by the hypothesis, while the other satisfies all these constraints. Apparently, two such descriptors should not be considered equally adequate, the smaller should be rejected while the greater should be accepted in a similarity search involving a
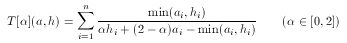
hypothesis. To tackle this problem asymmetrical metrics bias toward the hypothesis in the case of 'larger' descriptors with a predefined ratio α:
For simple technical reasons, an equivalent form is used in ScreenMD, since it is more natural to keep the asymmetry ratio between zero and one (and not two). The asymmetrical nature of this metric means that the role of a and h cannot be interchanged.The higher the value of the asymmetry ratio (α) the more the 'smaller' descriptor is penalized.
It is good practice to use asymmetric metrics when a compound library is sought for a hypothetical descriptor.
Asymmetrical and scaled metrics can be combined into a scaled asymmetric metric that exploits the benefits of both scaling with and directing toward a hypothesis descriptor.
All above extensions to integer descriptors work for real valued descriptors, too.
Euclidean distance
The most widely used geometrical distance function, the Euclidean distance can be used to measure the distance (dissimilarity) between two non-spatial objects, in our case between two molecular descriptors. The formulation is very straightforward:
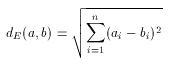
Note that this distance is a dissimilarity function in the sense, that 0 value represents total similarity. However, the Euclidean distance of two molecular descriptors is not upper-bounded: the larger the distance the higher the dissimilarity between the two descriptors. One could think that this characteristic of the Euclidean metric allows more accurate measurement of dissimilarity, but in practice this is seldom needed. Instead, the direct comparability of dissimilarity values is important. This is hard to achieve with the use of Euclidean distance since dissimilarity values obtained for a large compound library are scattered in a wide range and one should not necessarily have a priori ideas about suitable threshold for the dissimilarity value for acceptance/rejection. (In contrast to this, it is fairly simple to give such threshold value in the case of the above discussed Tanimoto metric, for instance 0.2 is a common choice and it can be interpreted as "at most 20% dissimilarity is still accepted", or "at least 80% similarity is required".)
With these considerations in mind a natural requirement is to allow to use the Euclidean distance as a dissimilarity metrics, that is, one that computes dissimilarity ratios between 0 and 1, and not distance values between 0 and infinity. Such metric is called the Normalized Euclidean dissimilarity metric and can be defined as
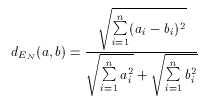
Since values of dEN fall into the interval 0-1, it is a dissimilarity metric.
Euclidean distance could be normalized various ways but the above form has one important advantage over many others, namely that it makes the absolute distances between the two descriptors' components relative, that is, proportional to the value of those components. To illustrate this idea image four descriptors consisting of three components (e.g. molecular weight, pKa and polar surface area). Let the values of the first components (the molecular weight) be 44, 135, 880, 919, respectively. The absolute distance between the first two is 91 while between the last two 99. Despite that 99 is greater than 91, the latter two should be considered more similar to each other than the first two. According to the above formula the relative difference between the first two is 91 / ( 44 + 135 ) = 0.5, while between the third and the fourth it is 99 / ( 880 + 919 ) = 0.05, which indicates a high degree of similarity between these two descriptors.
Weighted Euclidean metric
In general, Euclidean is not any better than Tanimoto dissimilarity, just different. Their behavior on a certain target and query set, and molecular descriptor in question cannot be predicted, only tested. Therefore some software tools have been developed to assist the user in selecting the metric which suits the particular needs the best. However, as Tanimoto with the scaling principle, Euclidean can be improved significantly by weighting. In contrast to scaling, which is applied to the entire descriptor in a uniform way, weighting distinguishes between components of the descriptor: an independent weight factor is associated with each individual component of the descriptor. This allows the increase or decrease of the importance of each individual feature in the dissimilarity calculation:
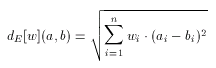
Rich descriptors, for which n, the length of the descriptor is large, (e.g. a few hundreds) require a large number of weights. In order to achieve the best selectivity over a certain set of compounds these values need to be adjusted. Due to the large number of weights and also to their high dependency on each other, however, it is not feasible to adjust these weights manually. To alleviate the selection and tuning of weights (in a molecular descriptor specific manner) software tools are available in the molecular descriptors package. Applying such optimization techniques to set up the suitable weighting schema for a given pharmacological target can significantly improve the quality of hits found in a screening process.
Asymmetric Euclidean metric
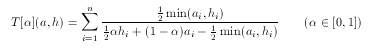
The Euclidean dissimilarity metric is symmetrical which, as explained above, can be a drawback when comparing descriptors to a hypothesis. To tackle this problem an asymmetrical version of the ordinary Euclidean metric can be defined. The idea is the same as in the case of asymmetric Tanimoto, though the formulation is different (since the base metric is different):
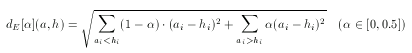
Note that the value of α should not be larger than 0.5 since only the case when ai < hi has to be penalized.
Dissimilarity of Molecular Descriptor Sets
The distance (dissimilarity) of descriptor sets can be calculated as the weighted Euclidean distance of the corresponding components:
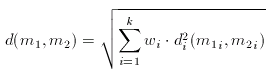
In the formula above, the component-wise dissimilarity function is an arbitrary dissimilarity metric and the index i indicates that the dissimilarity functions are independent (that is one can use Tanimoto for the first component while weighted Euclidean for the second etc.).
Usage
Virtual screening is available through the ScreenMD command. It has two different ways of usage:
-
Passing parameters in the command line:
screenmd [<target input file>] <query input file>[<[options |#options]>] -
Passing parameters in an XML configuration file:
screenmd [<configuration file name> |#config]These two modes are not strictly exclusive, they can be mixed various ways. Command line parameters can extend settings provided in the configuration file. File names can be specified in the command line even when parameters are defined in the configuration file, in this case the files defined in the command line are processed. However, this kind of usage is recommended only for expert users. Thus the exact specification of the command line syntax is as follows:
screenmd [<configuration file name> |#config] [<target input file>] <query input file>[<[options |#options]>] Note that when specified, the configuration file must be the first argument after the screenmd command in the command line. Similarly, file names are positional, if input is taken from file, filenames must follow either the command name or the name of the configuration file. Also note, that the order of the filenames is definite: first the target file is specified, followed by the name of the query file.
Prepare the usage of the ScreenMD script or batch file as described in Preparing the Usage of JChem Batch Files and Shell Scripts.
The ScreenMD class can be invoked directly:
-
Win32 / Java 2 (assuming that JChem is installed in c:\jchem):
    java -cp "c:\jchem\lib\jchem.jar;%CLASSPATH%" \
        *chemaxon.descriptors.ScreenMD* [<target input file>] <query input file> [<[options |#options]>]
-
Unix / Java 2 (assuming that JChem is installed in /usr/local/jchem):
    java -cp "/usr/local/jchem/lib/jchem.jar:$CLASSPATH" \
        *chemaxon.descriptors.ScreenMD* [<target input file>] <query input file> [<[options |#options]>]
Options
Options and parameters can either be defined in the command line or be specified in an XML configuration file. The command line mode is more suitable for smaller experiments. In contrast to this, configuring ScreenMD from XML is convenient even for much larger virtual screening exercises, in which, for instance, numerous descriptors are combined with various parametrized metrics. Although an example configuration file is available, users are not encouraged to write such configuration files manually. Instead, the use of an interactive XML configuration editor is highly recommended.
General options:
  -h, --help               this help message
  -x, --expert-help        advanced options for expert users
  -v, --verbose            verbose
  -s  --saveconf           saves database settings

Input/Output options:
  -a, --table-name <name>  name of the structure table
  -q, --query <where>      where clause of select statements to read targets
  -o, --output [ TABLE | SDF ] <filepath>
                           output file type and name with full path
                             Flag can be given more than once
  -g, --generate-id [<first>]
                           generate unique structure identifiers
                             an optional value for the first ID can be given
  -e, --precision <prec>   number of decimal places after the decimal point

Database options:
  -d, --driver <JDBC>      JDBC driver
  -u, --dburl <url>        URL of database
  -l, --login <login>      login name
  -p, --password <pwd>     password

Descriptor options:
  -k, --descriptor <type> <descriptor options>
                           create and use descriptors of the given type
  -k, --descriptor <name>  use descriptors created and stored previously

Descriptor options:
  -c, --config <configfile>
                           path and name of the XML configuration file
  -t, --use-tag [<name>]   use existing descriptor data
  -M, --metric \{<name>\}    use the metric <name> as specified in the config file
                             More than one metrics can be specified.

Similarity options:
  -L, --threshold          dissimilarity threshold
  -Q, --compare-queries    compare against query descriptor sets
  -H, --compare-hypothesis [<name> [C]]
                           generate hypothesis <name> and compare against it
                             Valid names are: Minimum, Average, Median.
                             Default hypothesis type is Minimum.
                             'C' indicates consensus fingerprint.
                             This flag may occur more than once with different
                             hypothesis types.


Advanced options for expert users:

SDfile options:
  -I, --id-tag <name>      name of the tag storing unique molecule identifiers
  -N, --mol-name <name>    name of the tag storing compound name

Database options:
  -O, --proptable <table>  name of the property table

2D pharmacophore fingerprint options:
  -P, --PMAP-tag [<name>]  use existing PMAP data

Similarity options:
  -C, --component-wise     apply threshold for individual descriptors
  -r, --descriptors-and    thresholds for all descriptors, default is any
  -m, --metrics-and        thresholds for all metrics, default is any
  -Z, --zero-threshold     percentage threshold for zero limit in median
                             hypothesis
Merging short forms of command line options is not supported, that is, instead of -rm the form -r -m should be used.
In the XML configuration file the same parameters can be defined. These options appear in the config configuration editor labeled with the above long forms of command line parameter names, with only small differences. In most of the cases only the first letters of words are capitalized. For example --compare-queries is displayed as CompareQueries. In other cases, especially when the option has parameters, instead of one edit field, a frame has to be filled in. For example, --compare-hypothesis is exchanged with a frame, where all the hypotheses can be specified with their type and a consensus can be selected. The use of the configuration editor is very straightforward and simple.
To use ScreenMD a valid license key is needed. When no valid license key is found in the home directory, ScreenMD runs in demo mode, where the number of molecular descriptors to be processed is limited to 2000 (thus if several types of molecular descriptors are generated, then the number of structures may be limited to few hundreds).
Database Connections
For more information on setting connection parameters:
-
JDBC driver's class name (--driver)
-
JDBC URL of database (--dburl)
-
Login name (--login)
-
Password (--password)
-
please visit the Administration Guide of JChem .
Input
The target library to be screened can be retrieved either from a database or from a file, in both cases either structures or molecular descriptor sets can be processed. In contrast to this queries are always read from and SDfile. Target structures/descriptors can either be taken from a database or from a file, while query structures are specified in a molecular file. Targets can either be molecular structures or molecular descriptors (generated earlier with GenerateMD). Most molecular file formats are accepted.The type and the source of the target set is determined by the command line flags according to the rules below:
-
if -a is specified target come from a database
-
if a descriptor type name is given after the -k flag then structures are retrieved, and descriptors are generated on-the-fly (in this case the -c flag is mandatory)
-
otherwise, the name of a molecular descriptor generated and stored in the database earlier is given after -k (in this case the -c flag is not allowed)
otherwise target come from a text file
-
if a descriptor type name is given after the -k flag then structures are read from a molecular structure file, and descriptors are generated on-the-fly (in this case the -c flag is mandatory)
-
otherwise, the name of a molecular descriptor file is given after -k (in this case the -c flag is not allowed)
If the target input file is an SDfile, it may already contain descriptors of molecules. This information can either be used or ignored in screening. The default behavior of ScreenMD is to ignore such information. This can be overridden with the --use-tag flag, in which case descriptors are not generated from the original molecular structures, but taken from the input file.
The default SDfile tags for storing molecular descriptors and related data are:
-
CF, chemical fingerprint,
-
PMAP, pharmacophore point type map,
-
PF, 2D pharmacophore fingerprint.
Other than the default tag names can be specified with the --use-tag and --PMAP-tag options.
SDfiles containing descriptors can be generated with GenerateMD. Existing descriptors are worth being reused as doing so can dramatically reduce running times (since descriptor generation is more time-consuming than the comparison of descriptors). Though SDfiles are capable of storing such data, the best practice is to store descriptors in database tables as it is more efficient, easier to share among users and easier to maintain their consistency.
When screening through a structure table in a database all structures (or their descriptors, depending on the actual command-line) are processed. To restrict the scope of screening, the WHERE clause of an SQL SELECT statement can be specified. In this case only the logical expression should be written.
Screening a structure file or structure table is typically much slower than using descriptors directly. Yet, screening structures can be important when descriptor parameters are tuned for the sake of optimal settings. For instance the minimal and maximal distances, pharmacophore point type definitions, the fuzzy smoothing factor and many other parameters have strong influence on the modeling power of the descriptor. It is a good practice to find a few promising settings in several coarse-grained screening experiments using on-the-fly descriptor generation and store only the best descriptors in the database.
Output
ScreenMD writes its results into a text file (--output option). If no output is specified, results are written to standard output. By default, results of the comparisons are printed in a table. Each row corresponds to one target structure (in their original order as read from the input source). The first column contains either the optional identifier of the target molecule as read from the input (--id-tag) or a positive integer value generated by the program. The number of further columns depends on
-
the number of query structures (nq),
-
the use of a hypothesis,
-
the number of dissimilarity metrics (nm).
If a hypothesis is constructed, then the next nm columns correspond to the similarity coefficients obtained from the comparison of the target structure to the hypothesis using the selected metrics. If the target structure was compared against individual queries too, further nq·nm columns follows, grouped by nm (that is each group contains nm dissimilarity coefficients): dq1m1, dq1m2, ?, dq1mnm, dq2m1, ?, dqnqmnm, where dqimj is the dissimilarity coefficient obtained from the comparison of query qi using metric mj.
An alternative way to produce the output of a screening procedure is to write the hit-set (molecular structures accepted) along with dissimilarity values into an SDfile. This output format can be specified by -o sdf foo.sdf. Note, that the output modes are not exclusive both table and SDfile output can be printed simultaneously (-o sdf hits.sdf -o table hits.table).
Comments on Some Parameters
Screening uses a wide varieties of dissimilarity metrics that are specified in the configuration XML file. By default, all available metrics are used. To select one or more of these, the -M flag can be used.
Since several metrics and query structures can be used simultaneously, results (dissimilarity coefficients) of individual comparisons (i.e. one target against all queries and/or hypotheses) can be combined in filtering. The default behavior is less restrictive: if any of the coefficients calculated is under the corresponding threshold value the structure is accepted. However, if the flag -m (--metrics-and) is specified, dissimilarity coefficients obtained by each and every metrics must be under the threshold in the case of at least one query structure or hypothesis. Similarly, if -r (--descriptors-and) is set, the target is accepted only if all components of the descriptor is accepted. These two flags are independent, and they can be combined.
The default behavior behavior of ScreenMD is to compare all individual structures in the query set against all structures in the target set. However, when comparing against a hypothesis (the -H flag is specified), individual queries do not take part in the comparison process, only the hypothesis is compared against each target descriptor. This behavior can be overridden by the -Q flag, thus when -H -Q is specified together, than both hypothesis and individual queries are compared to targets.
The hypothesis (-H) flag may take one or two optional parameters. The first of these is the name of the hypothesis, which by default is Minimum. Another available options are Average and Median. The second optional argument is the character C, which refers to consensus. When this is specified for a certain hypothesis, then that hypothesis is used as consensus descriptor for scaled metrics.
The advanced flag -Z is used to set the zero threshold for median hypothesis. This threshold is a percentage value. For each cell of the molecular descriptor the hypothesis cell is set to zero, if the percentage of zeros in the corresponding cells of the hypothesis component descriptors (descriptors, from which the hypothesis is calculated) is higher than the given threshold. If the percentage of zeros is lower, then the median of non-zero values is taken.
By default one dissimilarity value is obtained for each pair of compounds compared regardless the number of component of the descriptor sets (according to the formula defined above). However, it is also possible to get dissimilarity values for all components of the descriptor set by specifying the -C, --component-wise flag. Note, that in the case of one descriptor (one component in the descriptor set) component-wise dissimilarity is calculated.
Configuration Files
Besides the XML configuration file that can be optionally used to specify parameter settings, the ScreenMD application takes mandatory configuration files, too. These files correspond to molecular descriptors used for screening, so there should be one file per descriptor.
Different descriptor types require different parametrization. The actual parameter settings are defined in external text (XML) files.
2D pharmacophore fingerprints
The pharmacophore configuration file has three main sections. One of these, the <ScreeningConfiguration> is directly related to screenmd. This section defines the metrics in <ParametrizedMetric> elements. Normally, the user of ScreenMD does not need to edit these definitions, since they are either provided as 'factory settings' or they are generated and written into the configuration file by other utilities. A brief explanation on all required and optional values (XML attributes) are given below.
Name is always required, this specifies the user defined name of the metric. This can be an arbitrary name which is printed in the outputs (hit sets), and this is the name to refer to a specific metric after the -M flag.
ActiveFamily distinguishes between different versions of the same base metric (e.g. Euclidean) applied to different therapeutic areas. Such distinction is needed because different areas need different settings for metric's parameters in order to produce optimal hits. The name of the active family helps the user to find the right metric for his or her particular needs.
Metric is the name of the base metric (dissimilarity metric). At present two base metrics are available: Tanimoto and Euclidean.
Normalized indicates that the metric is normalized or not.
Threshold sets the limit for dissimilarity ratios to be accepted.
AsymmetryFactor is used in asymmetrical metrics.
ScaleFactor is used in the scaled metrics. In the present implementation Tanimoto metric can be scaled.
Weights specify individual weight values for each fingerprint cell used by the metric. However, if the user requires to tweak the weights of the Euclidean metric, each weight value can be written as an individual element. In this case a weight values does not directly correspond to a fingerprint cell, but to a pharmacophore point type (e.g. donor, acceptor) or to a topological distance.
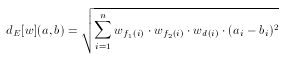
where f1(i) and f2(i) denote the two pharmacophore types associated with the i-th cell and d(i) is the corresponding topological distance.
There are much less weights in this case than in the cell-wise weighting of the fingerprint: the number of pharmacophore point types + the number of topological distances considered.
Chemical fingerprints
Chemical fingerprints take three parameters that can be defined in the <Parameters> section. These are Length which is the number of bits in the fingerprint. The default value is 512, values smaller than 128 result in poor descriptors. The number of bits should be multiple of 32. BondCount determines the longest path considered, and BitCount specifies the number of bits to be turned to 1 in the fingerprint for each feature identified.
The other two sections, <StandardizerConfiguration> and <ScreeningConfiguration> are the same as in the case of any other molecular descriptor.
It is important to know, that molecular descriptor specific configuration/parameter definition files are not always given in an explicit manner, only if both target and query sets are taken from molecular structure files. In all other cases configuration settings are stored either in a descriptor file or in the database when descriptors are generated with GenerateMD.
Examples
The following example reads the target and query molecular structures from files (targets.sdf and queries.smiles, respectively) and writes results to the standard output:
screenmd targets.sdf queries.smiles -g -k PF -c pharma-frag.xmlTarget structures are defined in the SDfile named targets.sdf, and query molecules are read from queries.smiles. Pharmacophore fingerprint parameters are taken from the configuration file (specified after the -c flag). As no metrics are selected all available ones are used. The target structures are compared against each individual query structures, no pharmacophore hypothesis is constructed. The output file contains a table of the dissimilarity ratios, like the one shown below:
id   q1_PF_Euclidean  2_PF_Euclidean  3_PF_Euclidean  4_PF_Euclidean
1       80.95        80.90        76.75        80.84
2       92.41        92.39        88.45        92.34
3       90.27        90.25        86.51        90.20
4       34.45        34.49        31.79        34.48
5       54.19        54.22        50.36        54.21
6       57.79        57.81        54.22        57.81
7       37.85        37.89        35.51        37.82
8       41.56        41.60        39.24        41.49
End of table
The above is the default format, where the precision of calculations and the display format is 2. The first number in each row is the index of the target molecule, which is generated by the program (-g flag).