Renderers
Widgets in a formview and the gridview itself have many visualisation options. These options are accessible under Customize Widget Settings button(  ). Visualisation properties can be set according the type of widget and the type of data shown in it. Every widget has its own visual properties depending on its nature or fields it contains (Sheet, Table). One common property to most widgets is a border including caption.
Renderers are desired for a particular field type, not for the widget itself. A renderer renders output of a field in a desirable form and is somewhat independent of the widgets. For instance a decimal number field uses the same renderer type in table and in text field widget, and so the renderer settings are identical, even though the widget settings are different.
Text renderer
You can set a font, size and style of the text. Text renderer can be used in table or in sheet widget for a number as well. Text can be wrapped in Multi-line field, aligning can be set horizontally and vertically. Additionally, conditional formatting can be used.
Number renderers
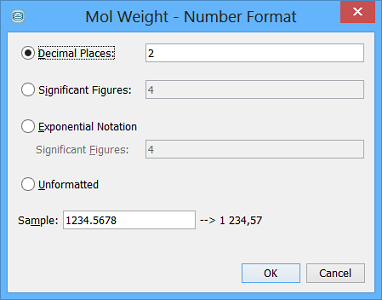
As for a text full font settings and alignment options are available for numbers too. You can enable or disable digits grouping of thousands in both integer renderer and float renderer. It is possible to set number format of a decimal number. All available options for decimal number format are seen in the screenshot.
Structure renderer
Structure field has very rich structure renderer properties. More details can be found at MolPane widget page .
Drawing structures by using sticks, ballsticks, wiresticks in 2D or 3D is the standard. It also support showing multiple structures in a grid. This is particularly useful for viewing stereo isomers. The same properties are available for structure fields in a Molecules matrix in addition to a number of rows and columns in a matrix. Extra text field, bound to a text column or a number column in the table, can be displayed in each cell of a Molecules matrix.
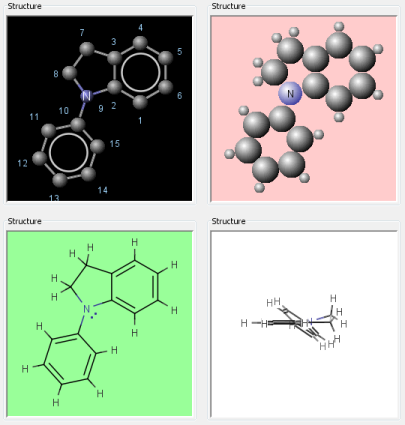
Table settings as a whole
Columns in a table can be re-sized and re-ordered. Implicitly all visible columns are fitted to the table width and horizontal scrolling is impossible. Row height in a table can be adjusted. Auto-resize row height option works as a button so every time you switch it on, row height is recalculated. There are also rich header settings options such as header height in lines, header alignment etc.
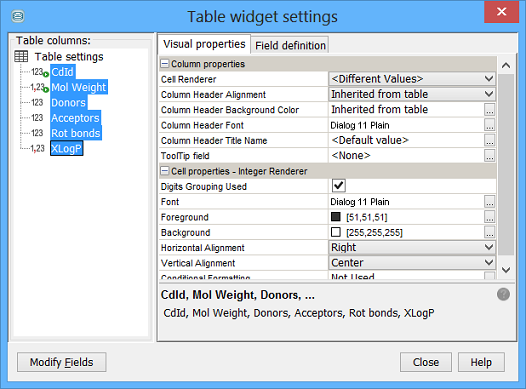
Column properties in general are shown in the screenshot. The most important of them is checkbox Visible for showing column in a table. Other specific column properties depends on the cell renderer for concrete data type. The settings are common for the table and for the gridview, which is in fact special case of a table.
The 'Horizontal Alignment' dropdown menu is not available when the user tries to bulk-change multiple fields with different renderers as the technical solution for multi-line text renderer is different than for text and float renderer.
Visualisation widgets
These involve histogram, scatter plot and radar chart in the present. More types of plots are expected to come in the future. These widgets are very specific. Only border setting is the property common with other widgets. Detail descriptions are written at the concrete widget page. General description of visualisation widgets is here .
RTF/HTML formated text renderer
This renderer offers capability to display formatted text in Text Field. Several widgets support rendering of RTF or HTML formatted text. For more information, see the relevant documentation.