Validation results
The following page contains validation results for some of ChemAxon's calculator plugins:
pK a validation results
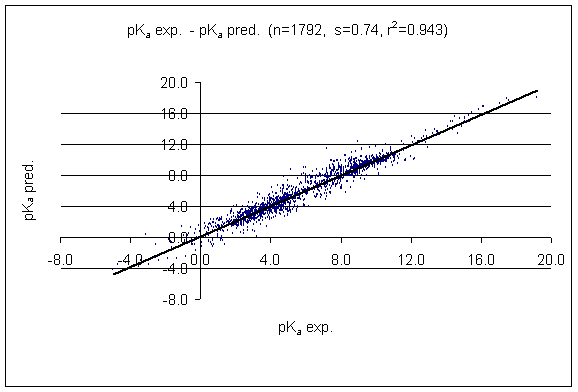
Fig. 1 Predicted vs. experimental results of the pKa calculation
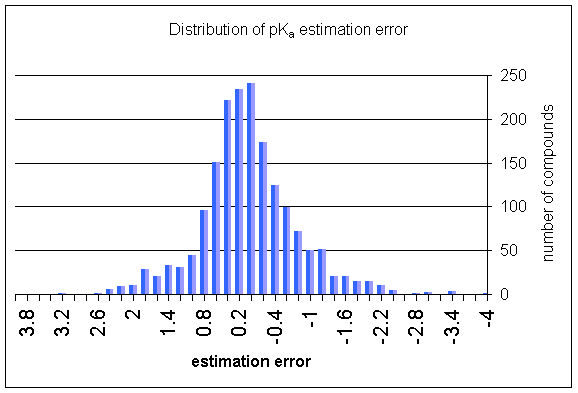
Fig. 2 Distribution of the pKa estimation error
A study comparing various pKa calculation results versus the measured pKa values of compounds was published by John Manchester et al. Read the article here.
log P validation results
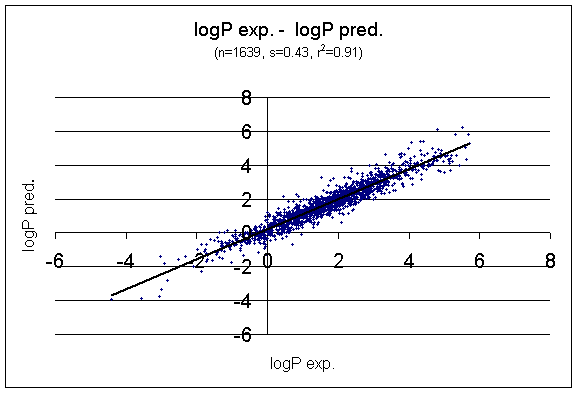
Fig. 3 Predicted vs. experimental results of the logP calculation
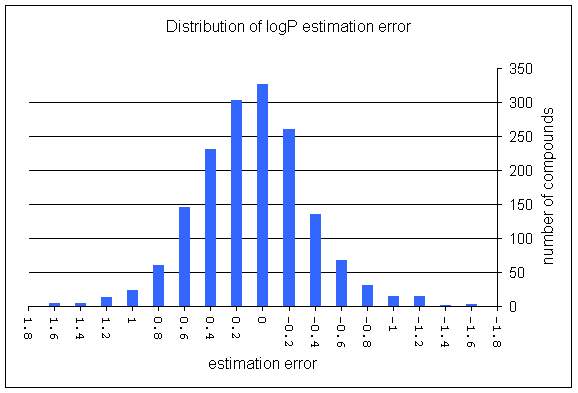
Fig. 4 Distribution of the logP estimation error
Average molecular polarizability validation results
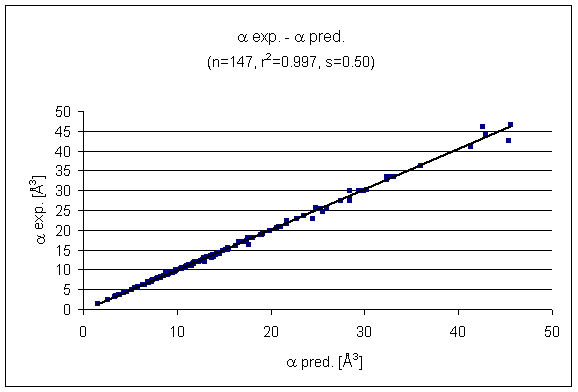
Fig. 5 Predictied vs. experimental results of the polarizability prediction
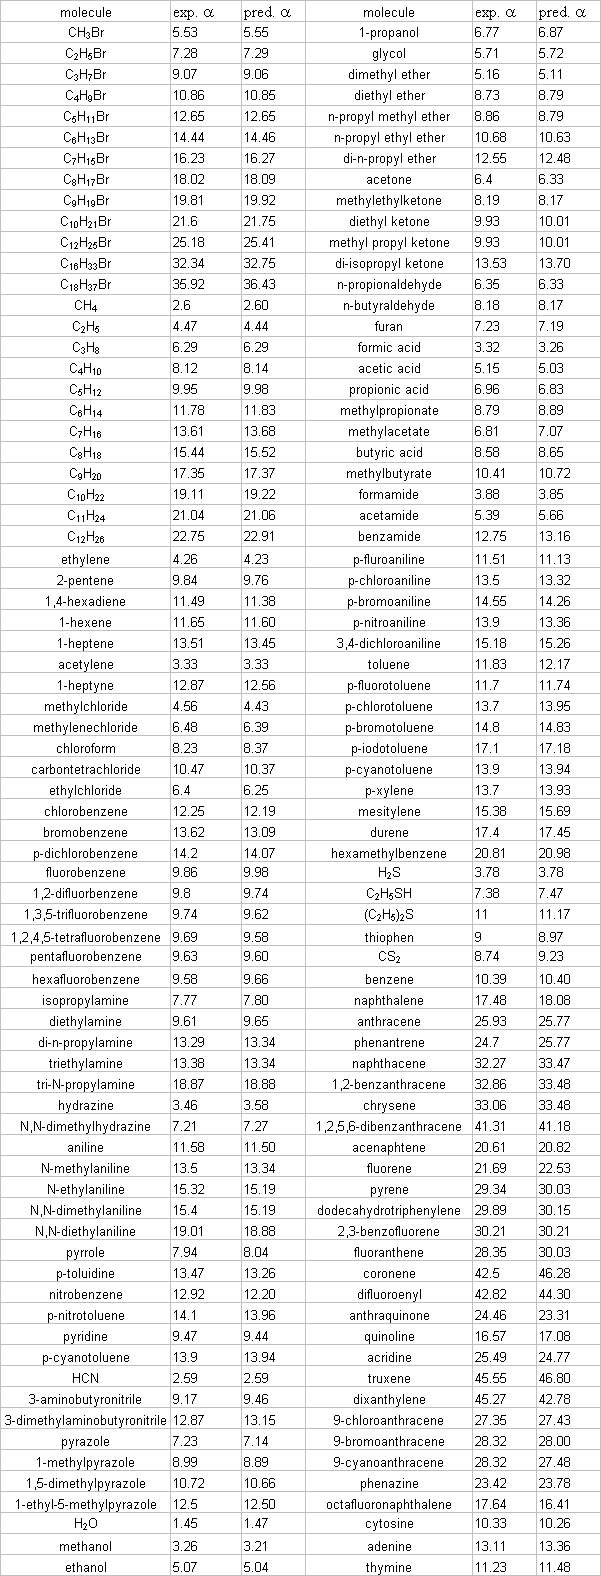
Table 1. Experimental vs predicted values
3D molecular polarizability validation results
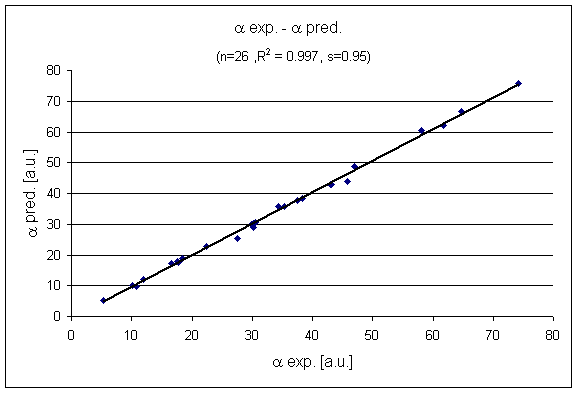
Fig. 6 Predicted vs. experimental 3D molecular polarizability values
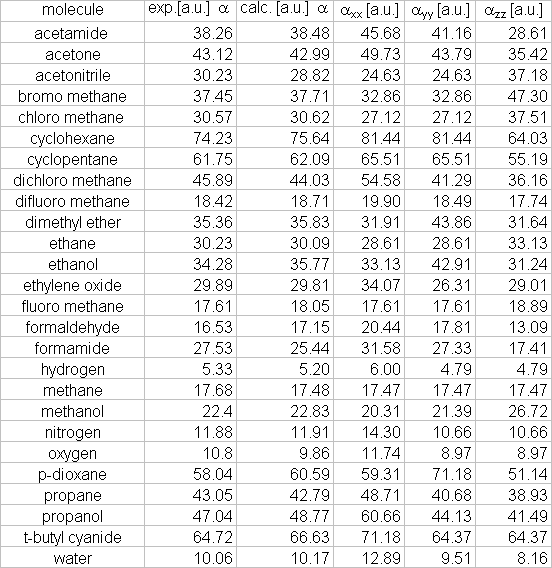
Table 2. Experimental 3D polarizability values