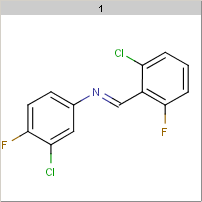
MarvinView Table View Example with Parameters
The aim in this example is to introduce the basic molecule table visualisation technique: the table layout of MarvinView. The example is simplified in order to focus on key elements.
Elements of table layout
The MarvinView table layout is implemented by the MViewPane class. It defines the table as a grid of individual cells arranged in a given number of rows and columns.
Molecules along with related data are placed in the cells. Not all cells are necessarily visible: the number of visible rows as well as the number of visible columns can be specified independently.
These basic properties of the table can be defined with a parameter String that is passed to the setParam method of the MViewPane class.
viewPane.setParams( // set total row count "rows="+totalRows+"\n" // set visible row count + "visibleRows="+visibleRowCount+"\n" // set column count + "cols="+visibleColumnCount+"\n" // visible column count + "visibleCols="+visibleColumnCount+"\n" );
Each cell is divided further and they have they own layout, which, however, is uniform for all cells in the table. This cell level customizability is useful when numerical and textual data are also displayed along with the molecular structure.
For the sake of ease the display of such data is not detailed in this example, each cell has a label and a molecule drawing underneath the label.

This cell layout is defined by a compact parameter String notation:
"layout=:2:1:L:0:0:1:1:c:n:0:1:M:1:0:1:1:c:b:1:1\n" // 2:1 -> 2 rows and 1 columns per cell; // L:0:0:1:1:c:n:0:1 -> first row and col (0:0:1:1) of the // cell is a label (L), centered (c) ... // M:1:0:1:1:c:b:1:1 -> second row in the first (and only) // column is a molecule (M), centered (c) ... + "param=:L:10b:M:200:200\n" // L:10b -> label is displayed in 10pt bold font // M:200:200 -> molecule is displayed in a 200x200 pixels area
The detailed description of the parameters (layout constraints) is not part of this example, one can simply accept that in most layouts "c:n:0:1" provides natural behaviour for the labels, while "c:b:1:1" makes the molecule drawings behave according to typical user expectations.
The table view is implemented by the java.awt.GridBagLayout class, and its parameters are counterparts of parameters in the GridBagLayout class and some further parameters are passed to the java.awt.GridBagConstraints class. Detailed description of the molecule table layout is provided in the Marvin Developer's Guide.
Setting molecules
Molecules to be displayed in the table are assigned directly to table cells. Cells are numbered from 0, starting in the top left corner from left to right and from top to bottom.
viewPane.setM(cellIndex, molecule);
The corresponding label is set similarly:
viewPane.setL(cellIndex, Integer.toString(cellIndex+1));
Note, that users prefer numbering starting from 1, thus the label of cell cellIndex is cellIndex + 1.

Source code:ViewTableParams.java